Figures & data
Table 1 Demographic And Clinical Data Of The Participants
Figure 1 Comparison of aortic stiffness index (A), carotid intima-media thickness (B) and epicardial fat thickness (C) among the normoalbuminuria and microalbuminuria groups.
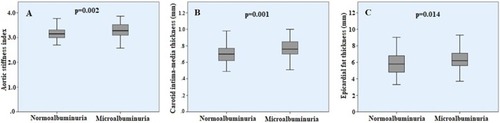
Table 2 The Correlation Between Albumin-To-Creatinine Ratio And Clinical/demographic Variables In T2DM Patients
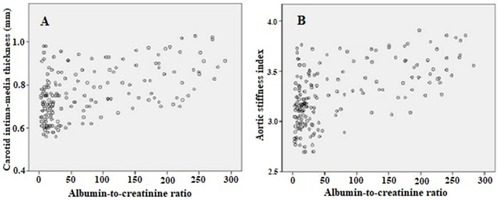
Figure 2 Scatter plot showing correlation of albumin-to-creatinine ratio with carotid intima-media thickness (A) and aortic stiffness index (B).