Figures & data
Figure 1 (A) In the normal range of blood glucose levels, the majority of glucose is reabsorbed in the kidney predominantly via the action of SGLT2 and GLUT2 in the S1 segment of the proximal tubule. (B) SGLT2 inhibitors block the reabsorption of glucose in the S1 proximal tubule under normal or hyperglycemic conditions, resulting in urinary glucose excretion.
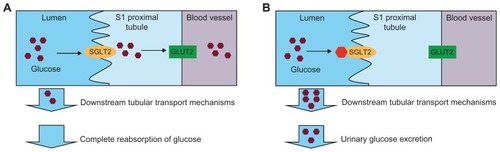
Figure 2 SGLT2 expression was determined in an array of 72 human tissues. Shown are representative tissues quantified using TaqMan quantitative PCR analysis with primer/probe sets designed to amplify and detect regions of (A) exon 6–7 and (B) exon 13 of SGLT2 and normalized to GAPDH.
Abbreviations: SGLT, sodium-glucose cotransporter; PCR, polymerase chain reaction; GAPDH, glyceraldehyde-3-phosphate dehydrogenase.
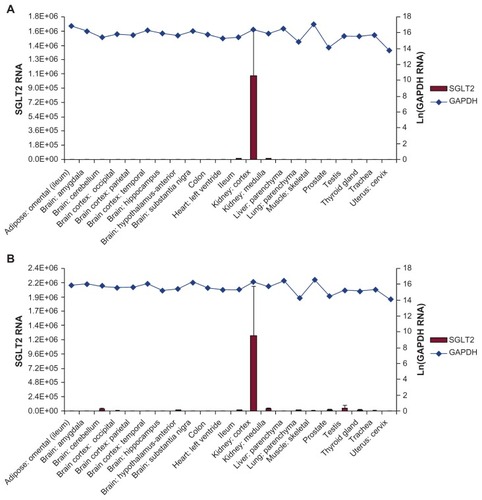
Figure 3 Single oral doses of dapagliflozin were demonstrated to stimulate an increase in urinary glucose excretion in Zucker diabetic fatty rats (A) over 6 hours, and (B) 24 hours post dose.
Abbreviation: BW, body weight.
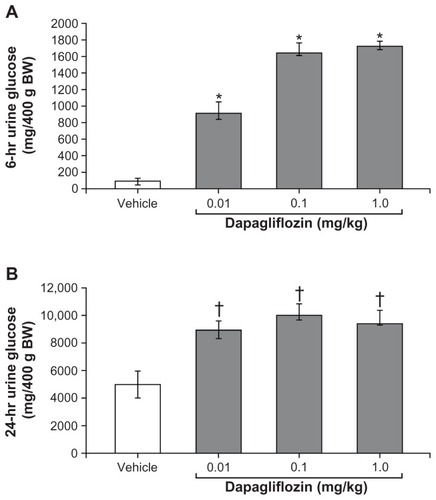
Figure 4 Once-daily oral administration of dapagliflozin resulted in significant, dose-dependent reductions in the plasma glucose of fed and fasting Zucker diabetic fatty rats over 15 days.
Abbreviation: Ad lib, Ad libitum.
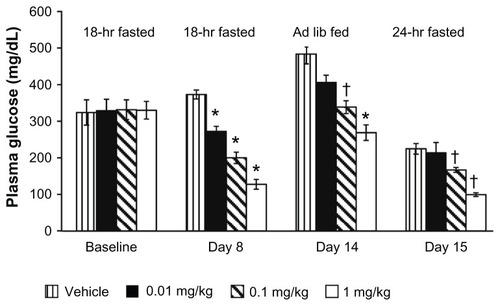
Table 1 Glycemic efficacy of 10 mg dapagliflozin for initial Phase III trials
Table 2 Body weight changes associated with 10 mg dapagliflozin for initial Phase III trials
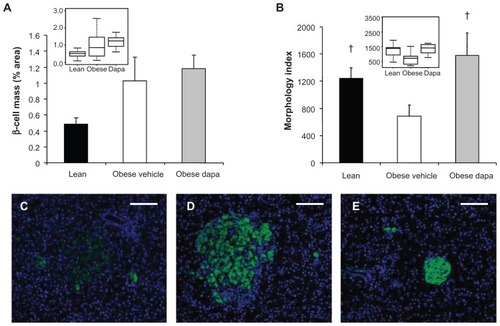
Figure 5 Dapagliflozin treatment of Zucker diabetic fatty rats at the initiation of a high-fat diet (A) did not have a significant effect on β-cell mass and (B) improved islet morphology. Box plots of the same data presented as insets. Representative 10× images of immunofluorescently stained β-cells (anti-insulin, green) and Hoescht-stained nuclei showed (C) poor islet morphology and scattered β-cells in obese, vehicle-treated Zucker diabetic fatty rats compared with (D) improved islet morphology and insulin-staining intensity in dapagliflozin-treated animals. Islet size was increased in these obese, dapagliflozin-treated rats compared with (E) lean Zucker diabetic fatty rats.
Abbreviation: Dapa, dapagliflozin.