Figures & data
Figure 1 Renal glucose transport.
Reproduced with permission: Vallon V. Am J of Physiol Cell Physiol. 2011;300(1):C6–C8.
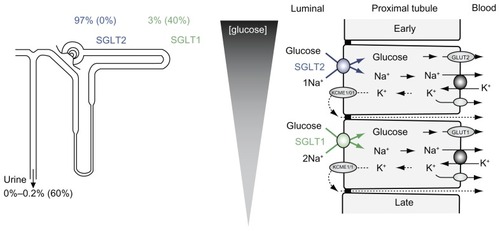
Figure 2 At plasma glucose concentration around 8.3 mmol/liter, glucose appears in the urine.
©2010 The Endocrine Society. Reproduced with permission from Nair S, Wilding JP. Sodium glucose co transporter 2 inhibitors as a new treatment for diabetes mellitus. J Clin Endocrinol Metab. 2010;95(1):34–42.Citation44 http://jcem.endojournals.org/.
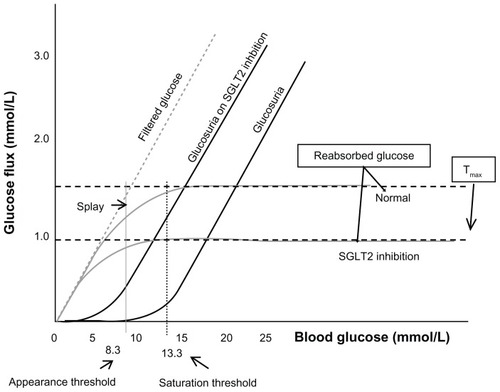
Figure 3 Change from baseline in A1c, percentage fasting plasma glucose concentration, and total body weight in dapagliflozin 2.5, 5 and 10 mg and placebo groups up to week 24. Reproduced with permission: Bailey et al. Lancet. 2010;375:2223–2233.
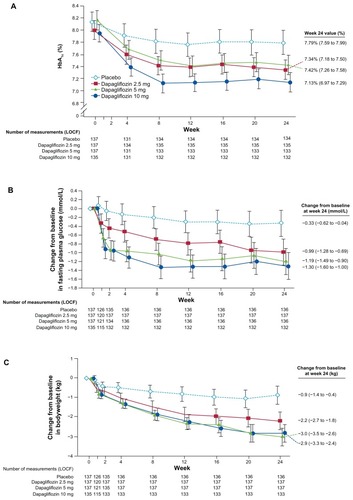
Figure 4 (A and B) Change in body mass component as measured by dual-energy X-ray absorptiometer fat mass and lean mass and Visceral Adipose Tissue (VAT) and Subcutaneous Adipose Tissue (SAT) volume as measured by magnetic resonance substudy, in type 2 diabetes patients inadequately controlled on metformin, randomized to dapagliflozin versus placebo.
©2012 The Endocrine Society. Reproduced with permission from Bolinder J et al. Effects of dapagliflozin on body weight, total fat mass, and regional adipose tissue distribution in patients with type 2 diabetes mellitus with inadequate glycemic control on metformin. J Clin Endocrinol Metab 2012;97(3):20–31.47.Citation22 http://jcem.endojournals.org/.
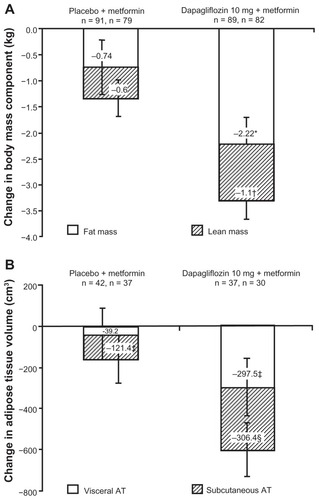
Figure 5 (A and B) Change in A1c and body weight over a 52 week trial of type 2 diabetes patients uncontrolled on metformin randomized to glipizide versus dapagliflozin. Reproduced with permission: Nauck et al. Diabetes Care. 2011;34(9):2015–2022.
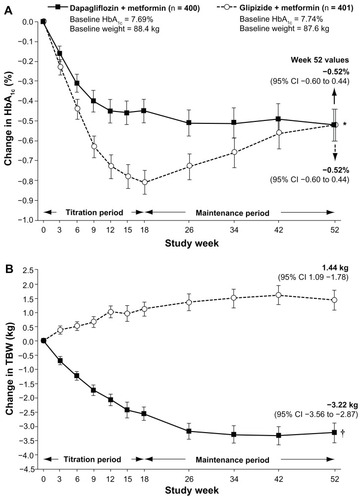
Figure 6 (A–C) Mean A1c, Fasting Plasma Glucose (FPG) and change in body weight from baseline over 12 weeks in patients with type 2 diabetes receiving insulin plus insulin sensitizers, randomized to dapagliflozin versus placebo.
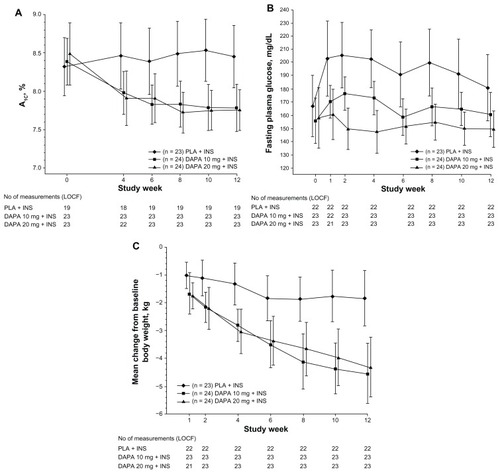
Table 1 Efficacy of dapagliflozin in various studies