Figures & data
Table 1 Details Of The 10 Genes Markers
Figure 1 (A) Endogenous Cdc42 expression level in ADSCs is up-regulated. Endogenous Cdc42 expression in ADSCs and rat islets was measured by Western blot. (B) ML141 suppresses the Cdc42 expression in IPCs. Cdc42 mRNA expression in control group, induction group and induction+ML141 group were measured by qPCR. Data were shown as the mean ± SD, n = 3. Values were significantly different compared with the corresponding control value at **p<0.01, ***p<0.001.
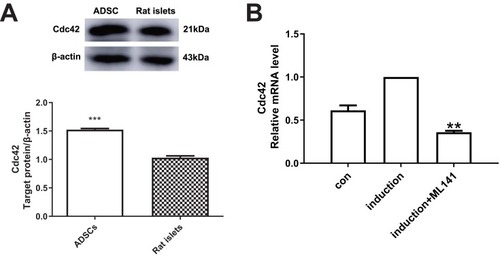
Figure 2 (A) Morphological changes of cells during IPC induction. Morphological changes of cells in the control group on days 3 (a), 6 (b) and 10 (c). Morphological changes of cells in the induction group on days 3 (d), 6 (e) and 10 (f). Morphological changes of cells were observed by inverted microscope. (B) ADSCs with DTZ staining. (a) Stained ADSC clusters in the induction group with intracellular brown particles (+) (100×magnification), and the zoom-in figure in the lower left corner (200×magnification). (b) No DTZ stained cells were found in the control group (−) (100×magnification). (c) mRNA expression changes of islet cell development–related genes in IPCs. qPCR was performed to measure the mRNA expression of islet cell development–related genes, including PDX1, Insulin, Ngn3, GLUT2 and NeuroD1. Data were shown as the mean ± SD, n = 3. Values were significantly different compared with the corresponding control value at *p<0.05 and **p<0.01.
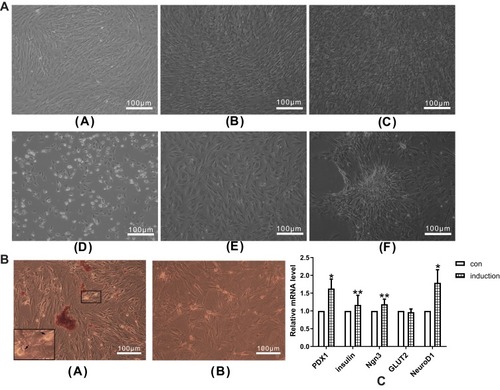
Figure 3 (A–C) Effect of ML141 and Wnt-3a on β-catenin, GSK3β, and TCF7L2 mRNA expression. qPCR detected the mRNA expression of (A) Non-p-β-catenin, (B) GSK3β, (C) TCF7L2 in IPCs after induction with Wnt-3a or ML141 administration. (D-I) Effect of ML141 and Wnt-3a on non-p-β-catenin, Dvl-2, p-GSK3β, non-p-GSK3β, and Cdc42 protein expression. Western blot measured the protein expression of (E) non-p-β-catenin, (F) Dvl-2, (G) p-GSK3β, (H) non-p-GSK3β and (I) Cdc42 in IPCs after induction with Wnt-3a or ML141 administration. Data were shown as the mean ± SD, n = 3. Values were significantly different compared with the corresponding control values at **p<0.01, *p<0.05, ##p<0.01 and #p<0.05.
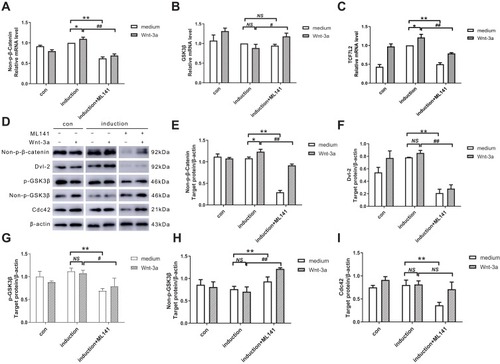
Figure 4 (A-D) ML141 suppresses the mRNA expression of PDX1, Ngn3, Insulin and GLUT2. qPCR detected the mRNA expression of (A) PDX1, (B) Ngn3, (C) Insulin and (D) GLUT2 in IPCs. (E-H) ML141 suppresses protein expression of PDX1, Ngn3 and Insulin. Western blot measured the protein expression of (F) PDX1, (G) Ngn3 and (H) Insulin in IPCs. Data were shown as the mean ± SD, n = 3. Values were significantly different compared with the corresponding control value at *p<0.05, **p<0.01, #p<0.05 and ##p<0.01.
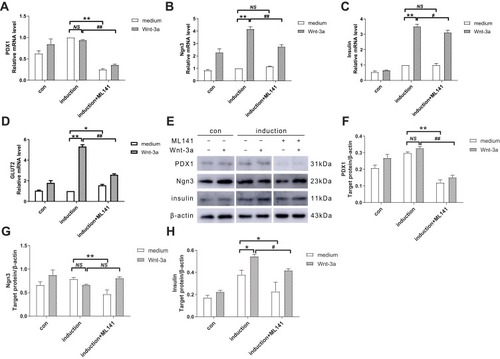
Figure 5 (A-B) ML141 inhibits IPC proliferation. CCK assay determined the cell proliferation rate at 24, 48 and 72hrs. (A) Proliferation rate of IPCs in induction group. (B) Proliferation rate of ADSCs in control group. Data were shown as the mean ± SD, n = 3. Values were significantly different compared with the corresponding control value at **p<0.01 and ##p<0.01. (C) ML141 inhibits Insulin protein expression in ADSC-derived IPCs. The Insulin protein expression levels were measured by immunofluorescence test in (a) control group, (b) control+Wnt-3a group, (c) induction group, (d) induction+Wnt-3a group, (e) induction+ML141 group, (f) induction+ML141+Wnt-3a group. The nuclei were labeled with DAPI (blue) and Insulin protein was labeled with the Alesa Fluor 488 (yellowish-green).
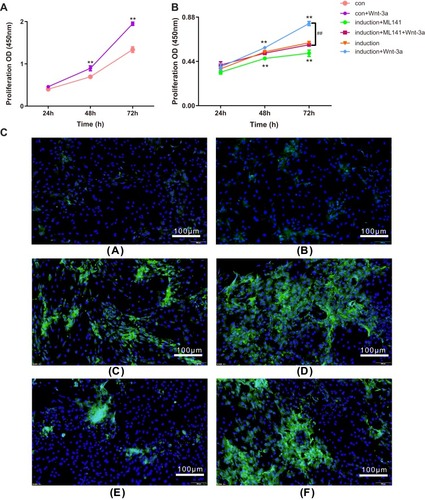
Figure 6 ML141 inhibits insulin secretion by ADSC-derived IPCs under high-glucose stimulation. Data were shown as the mean ± SD, n = 3. Values were significantly different compared with the corresponding control value at ##p<0.01, ###p<0.001, ***p<0.001, and +++p<0.001.
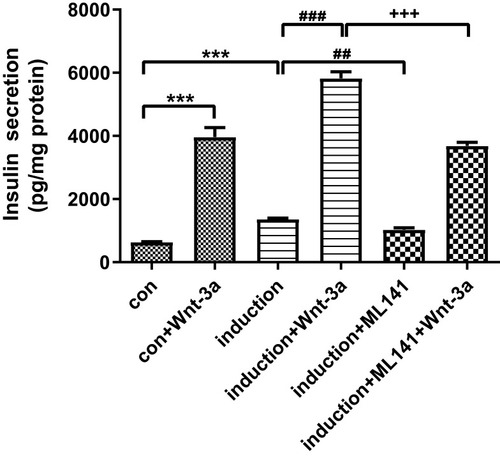
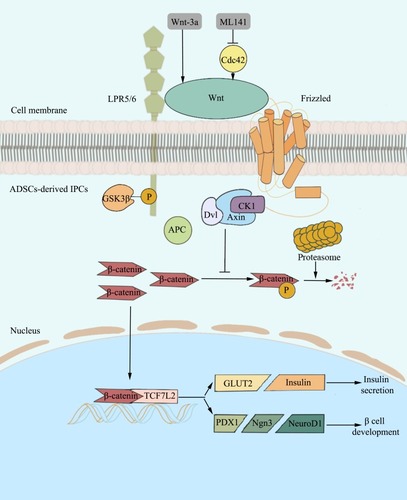
Figure 7 The mechanism of Cdc42/Wnt/β-catenin signaling pathway in ADSC-derived IPCs. Wnt-3a administration activates Wnt, which combines with LPR5/6 and Fz, and restores Dvl2 recruitment. GSK3β goes through phosphorylation to impede β-catenin phosphorylation by obstructing the combination of Dvl, GSK3β, Axin, and CK1. As a result, non-p-β-catenin escapes ubiquitin-proteasome-dependent degradation and activates TCF7L2 and downstream genes (PDX1, Ngn3, NeuroD1, GLUT2, and Insulin) after translocation to the nucleus. Eventually, Wnt/β-catenin signaling promotes ADSC-derived IPC development and insulin secretion. Cdc42 inhibition by ML141 leads to down-regulation of Wnt/β-catenin signaling. Therefore, interaction of Dvl, GSK3β, Axin, and CK1 promotes β-catenin ubiquitin-proteasome-dependent phosphorylation and degradation, ending up with inactivated target genes (TCF7L2, PDX1, Ngn3, NeuroD1, and GLUT2), thereby inhibiting ADSC-derived IPC development and insulin secretion.