Figures & data
Figure 1 Flowchart outlining the literature search process.
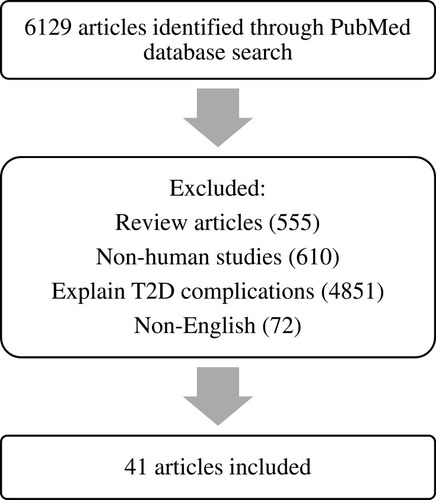
Table 1 Association Between Genetic and Prediction of T2DM
Figure 2 Impairments in the regulation of insulin and glucose may cause an increase in hepatic FTO expression.
Abbreviation: TG, triglyceride.
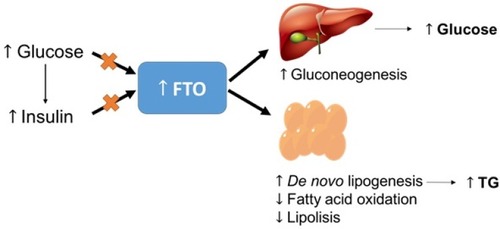
Figure 3 Transcription factor network in the pancreatic β-cell.
Abbreviations: GCK, glucokinase; GLUT-2, glucose transporter-2; L-PK, liver pyruvate kinase.
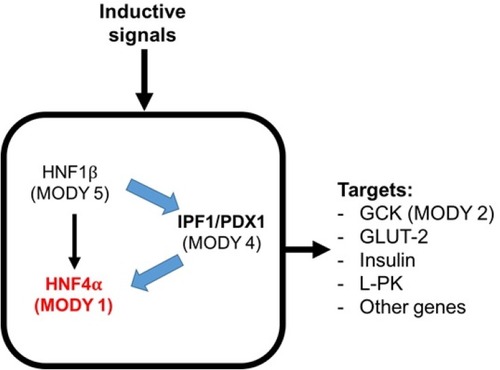
Figure 4 Probable mechanism of CKN2A/B-antisense noncoding RNA in the INK4 locus (ANRIL) gene product.
Abbreviation: ATM, adipose tissue macrophage.
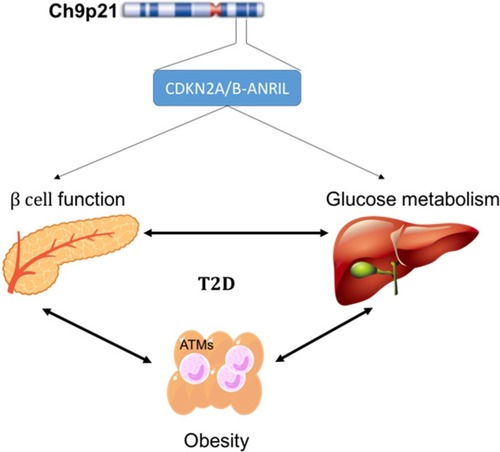
Figure 5 Possible role of TCF7L2 in the pathogenesis of T2DM.
Abbreviations: GIP, gastric inhibitory polypeptide; GLP-1, glucagon-like peptide 1.
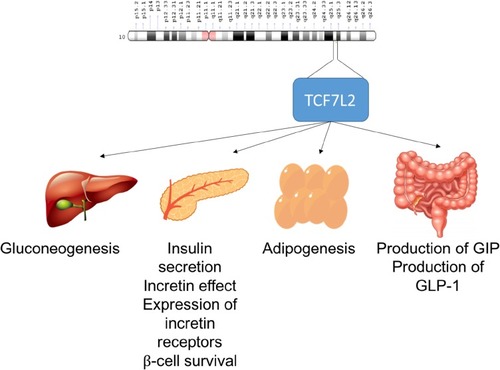
Figure 6 Mechanism of insulin secretion by the KATP channel in pancreatic β-cells. SUR1 and Kir6.2 proteins in the KATP channel mediate insulin secretion.
Abbreviations: ATP, adenosine triphosphate; Ca2+, calcium ion (composed of α1, α2, β, ɣ, and δ subunits); K+, potassium ion; KATP, ATP-sensitive potassium channel; Kir6.2, inward rectifier potassium ion channel; SUR1, sulfonylurea receptor-1.
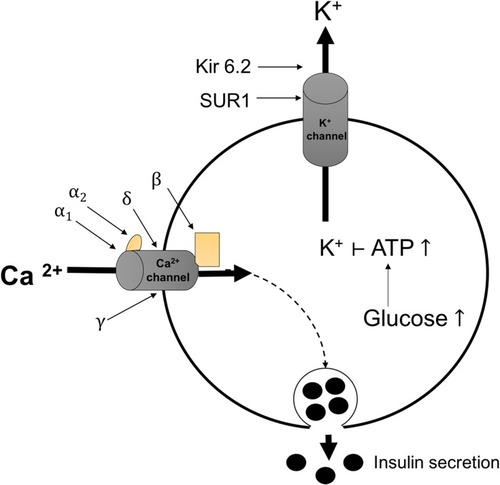
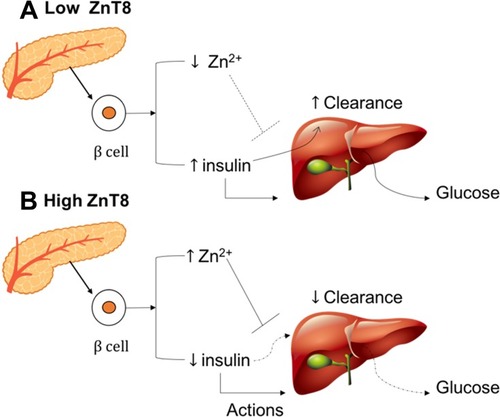
Figure 7 Interaction between ZnT8 expression (A) low ZnT8 and (B) high ZnT8, hormone action, and hepatic insulin clearance.