Figures & data
Table 1 The Effects of Curcumin on Blood Glucose, Serum Total Cholesterol (TC, TG) of Diabetic Mice by STZ
Figure 1 Curcumin decreased the levels of Scr, UAER and blood glucose in DN mice. (A) The levels of Scr were detected by the urine Creatinine Detection Kit. (B) The levels of urine albumin were measured by BCG albumin assay kit. (C) The glucose levels were detected at 0, 18, 36, 43 and 56 days after curcumin or CMC-Na treatment. Data were shown as mean±SD, n=6. **p<0.01 VS Normal.***p<0.001. #p<0.01 VS DN. ##p<0.01. ###p<0.001.
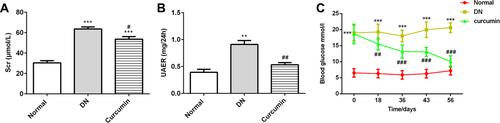
Figure 2 The pathological changes of the kidneys after curcumin treatment. (A) HE staining showed the pathological changes in renal. (B) PAS staining the pathological changes in renal.
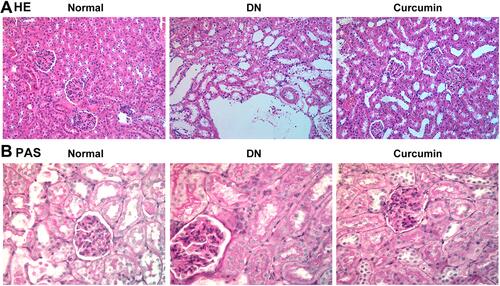
Figure 3 Effect of curcumin on renal cell apoptosis in DN mice. (A) The protein levels of nephrin and podocalyxin in the DN mouse renal were detected by Immunofluorescence staining. (B) The cell apoptosis was detected by tunnel staining. (C) Western blot assay showed that the expression of anti-apoptotic protein Bcl-2 and pro-apoptotic protein Bax and caspase-3 in DN mouse. Data were shown as mean±SD, n=6. **p<0.01 VS Normal. #p<0.05 VS DN.***p<0.001. ###p<0.001.
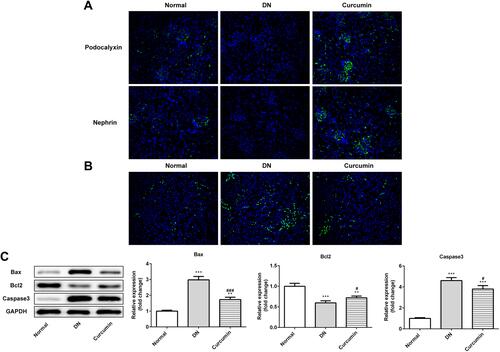
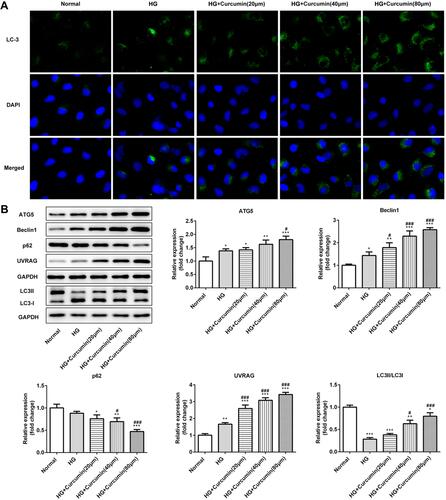
Figure 4 Effect of curcumin on podocyte autophagy in DN mice. (A) The protein levels of LC3 in the DN mouse renal were detected by Immunofluorescence staining. (B) Western blot assay showed that the expression of beclin1, P62, LC3, UVRAG and ATG5 in DN mouse. Data were shown as mean±SD, n=6. *p<0.05 VS Normal. #p<0.05 VS DN. **p<0.01. ***p<0.001.
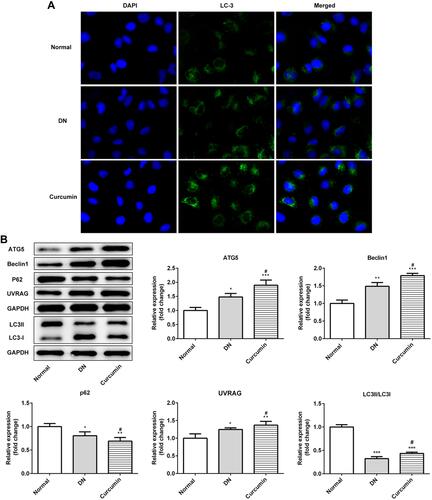
Figure 5 Effect of curcumin on podocyte activity and apoptosis induced by high glucose. (A–C) Podocytes were cultured with normal glucose (5.5 mM), high glucose (30 mmol/l) and curcumin at different concentrations (20, 40, 80 μM) for 48 or 72 h. The relative cell viability was assessed with CCK-8 and expressed as percent podocyte survival relative to that of the normal cells. (D and E) AV-FITC/PI staining was performed to quantify the apoptosis rates via flow cytometry. (F) Western blot assay showed that the expression of anti-apoptotic protein Bcl-2 and pro-apoptotic protein Bax and caspase-3 in podocytes. Data were shown as mean±SD. *p<0.05 VS Normal. #p<0.05 VS HG: high glucose. (HG+cucumin): high glucose+curcumin. **p<0.01.***p<0.001. ##p<0.01. ###p<0.001.
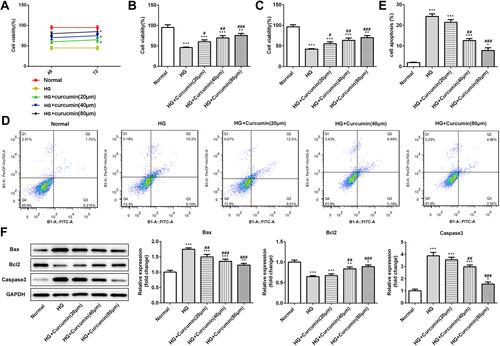
Figure 6 Effect of curcumin on podocyte autophagy and the expression of beclin1/UVRAG in medium containing high glucose. (A) The protein levels of LC3 were detected by immunofluorescence staining. (B) Western blot assay showed that the expression of beclin1, P62, UVRAG and ATG5 in podocytes. Data were shown as mean±SD. *p<0.05 VS Normal. #p<0.05 VS HG: high glucose. (HG+cucumin): high glucose+curcumin. **p<0.01. ***p<0.001. ###p<0.001.