Figures & data
Table 1 Sequences of Primers for Quantitative RT-PCR
Table 2 Metabolic Profile Analysis of Mouse Parameters
Figure 1 Renin expression in DKD mice treated with oral enalapril (5 mg/150 mL water) and combined treatment (enalapril and pGPU6-shEgr1 plasmid). (A) Expression level of renin mRNA among the four groups of DKD mice. (B and C) Expression level of renin protein measured by Western blotting. (D) Urinary renin measured using ELISA. The results are expressed as fold change over baseline (control group). Values are represented as mean ± SD. *P < 0.05, **P < 0.01 vs ahead group by Student’s t-test.
Abbreviations: E-DM, Mice treated with oral enalapril (5 mg/150 mL water); EG-DM, mice treated with enalapril and pGPU6-shEgr1 plasmid; GV-DM, mice treated with pGPU6 vector plasmid (n = 6).
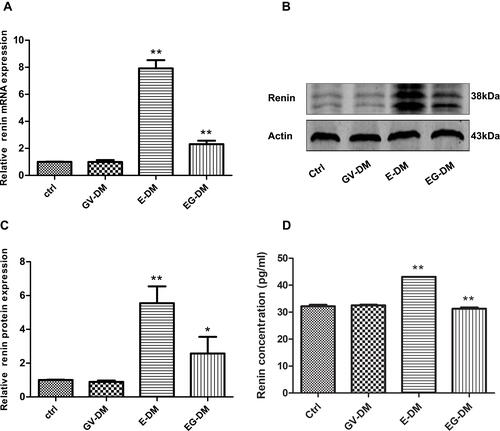
Figure 2 Kidney injury in DKD mice treated with oral enalapril (5 mg/150 mL water) and combined treatment (enalapril and pGPU6-shEgr1 plasmid). (A) Expression level of Egr1 mRNA among the three groups of DKD mice. The results are expressed as fold change over baseline (control group). (B) Urinary microalbumin concentration among the four groups of DKD mice. (C) Expression level of TNF-α and FN mRNA among the four groups of DKD mice. The results are expressed as fold change over baseline (control group). (D) H&E, Masson staining, and immunohistochemical staining of TNF-α and FN among the four groups of mice. Values are represented as mean ± SD. *P < 0.05, **P < 0.01 vs ahead group by Student’s t-test.
Abbreviations: E-DM, Mice treated with oral enalapril (5 mg/150 mL water); EG-DM, mice treated with enalapril and pGPU6-shEgr1 plasmid; GV-DM, mice treated with pGPU6 vector plasmid (n = 6).
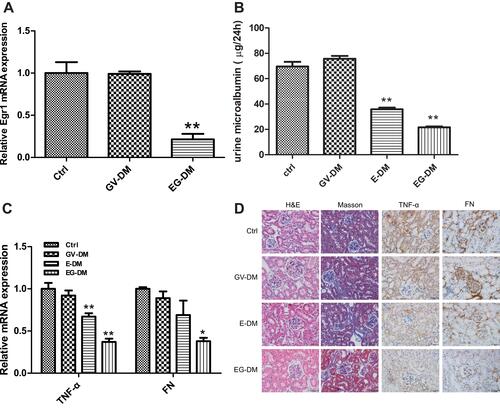
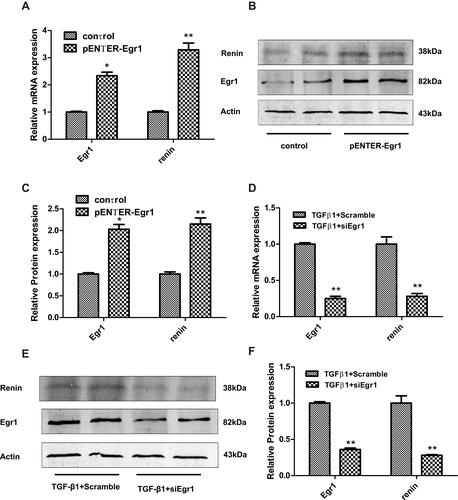
Figure 3 Renin expression following either overexpression or knockdown of Egr1 in SV40 MES 13 cells. (A) Cells were treated with either a pENTER-Egr1 overexpression plasmid or with a pENTER vector for 48 h, and the mRNA levels of Egr1 and renin were measured by RT-qPCR. (B and C) The protein levels of Egr1 and renin were measured by Western blotting. (D) Cells were either silenced with siEgr1 or treated with a scrambled control RNA for 48 h prior to exposure to TGF-β1 (10 ng/mL) for 24 h. The mRNA levels of Egr1 and renin were measured using RT-qPCR. (E and F) The mRNA levels of Egr1 and renin were measured by Western blotting. The results are expressed as fold change over baseline. Values are represented as mean ± SD. *P < 0.05, **P < 0.01 vs control group by Student’s t-test (n = 3).