Figures & data
Table 1 Basic Characteristics of the Study Subjects
Table 2 Correlation Analysis Between Metabolic Syndrome Severity and LHR/NHR
Table 3 Binomial Logistic Regression Analysis Showing Independent Predictors of Metabolic Syndrome in Females
Table 4 Binomial Logistic Regression Analysis Showing Independent Predictors of Metabolic Syndrome in Males
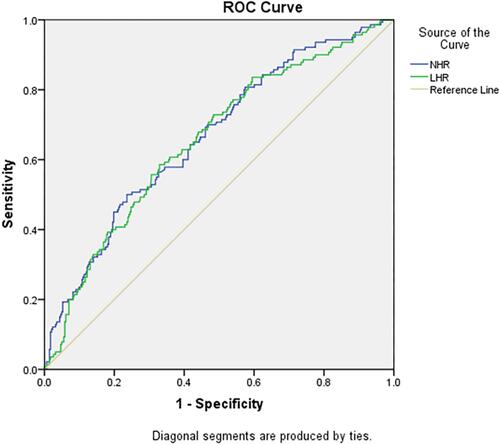
Table 5 Areas Under the ROC Curve (AUC), Sensitivity and Specificity by the Optimized Cutoff Points for LHR and NHR in Predicting Metabolic Syndrome
Figure 1 ROC curve analysis of the value of lymphocyte to high-density lipoprotein ratio (LHR), and neutrophil to high-density lipoprotein ratio (NHR) for predicting metabolic syndrome in females.
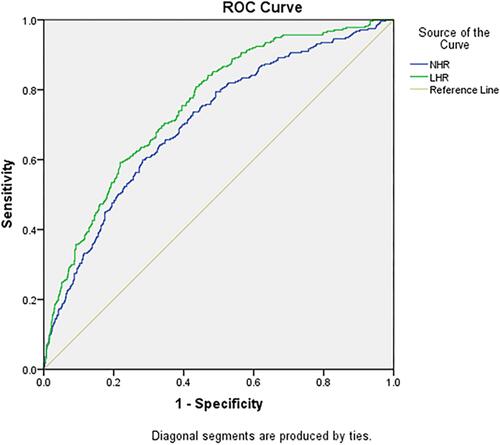
Figure 2 ROC curve analysis of the value of lymphocyte to high-density lipoprotein ratio (LHR), and neutrophil to high-density lipoprotein ratio (NHR) for predicting metabolic syndrome in males.