
Figures & data
Figure 1 CONSORT flow diagram.
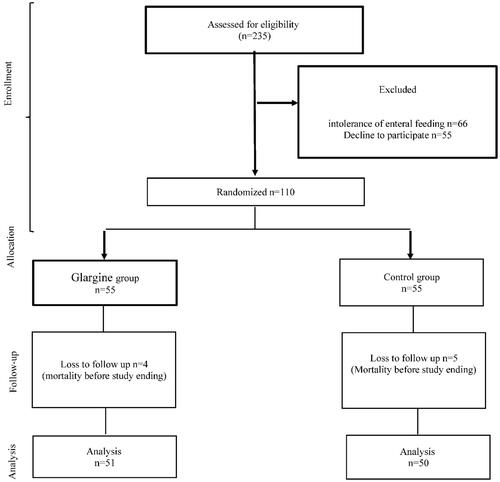
Table 1 Patient Characteristics and Comorbidities in Treatment Groups
Table 2 Clinical Outcomes of Patients in Treatment and Control Groups
Figure 2 Duration that patients in each group spent in target (140< blood glucose <180) every day for 7 days after admission. (A) Mean daily concentrations of blood glucose; (B) daily variation in measured blood-glucose concentration (~24–30 hourly measurements). HbA1c was adjusted in the analyses.
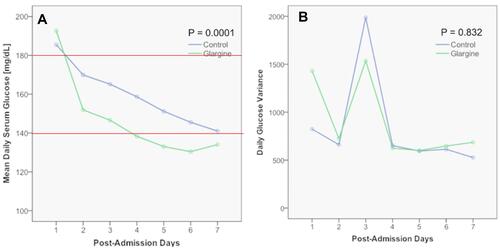
Figure 3 Repeated-measures analysis of daily additional requirement of regular insulin in the two arms of the study.
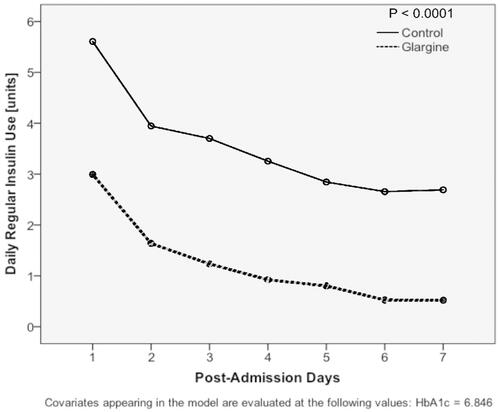
Table 3 Clinical Outcome of Patients According to Development of Hypoglycemia (BG <60 mg/dL) and Severe Hypoglycemia (BG <40 mg/dL)