Figures & data
Table 1 Characteristics of T2DM Participants with Different Abnormal Glycemic Phenotypes
Figure 1 Cumulative incidence of microvascular diseases stratified by abnormal glycemic phenotype for T2DM participants: (A) isolated diabetic retinopathy (IDR), (B) isolated diabetic nephropathy (IDN), (C) combined diabetic retinopathy and nephropathy (CRN). Log rank test for microvascular diseases of T2DM participants with different abnormal glycemic phenotype (all P<0.05 in pairwise comparison among three phenotypes: IDR, IDN and CRN).
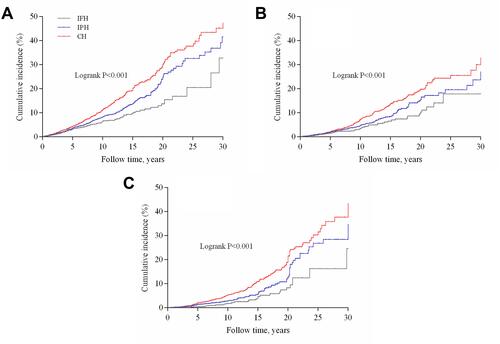
Table 2 Association Between Abnormal Glycemic Phenotypes and Microvascular Disease in Type 2 Diabetes Mellitus Participants
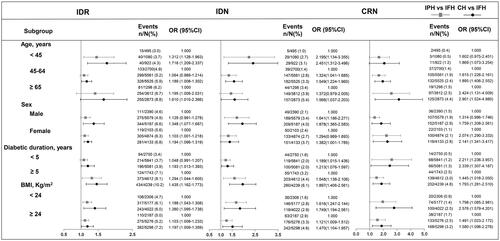
Figure 2 Subgroup analysis of association between abnormal glycemic phenotypes and microvascular complication for type 2 diabetes mellitus participants.