Figures & data
Table 1 Demographics and Baseline Characteristics by Body Weight Category
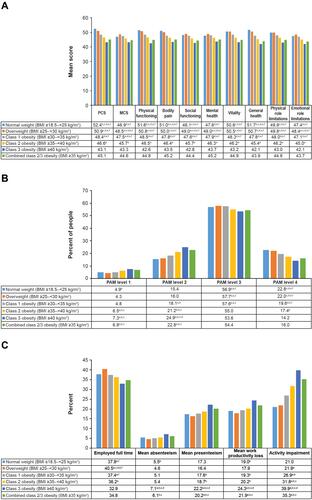
Figure 1 NHWS Results by BMI Category (A) Mean SF-36v2, (B) PAM, and (C) WPAI Scores.
Notes: aP<0.05 compared with normal weight. bP<0.05 compared with overweight. cP<0.05 compared with class 1 obesity. dP<0.05 compared with class 2 obesity. eP<0.05 compared with class 3 obesity. fP<0.05 compared with combined class 2/3 obesity.
Abbreviations: BMI, body mass index; MCS, mental component score; NHWS, National Health and Wellness Survey; PAM®, Patient Activation Measure®; PCS, physical component score; SF-36v2, 36-Item Short Form Health Survey; WPAI, Work Productivity and Activity Impairment.