Figures & data
Figure 1 Effects of curcumin and nano-curcumin on insulin resistance in studied rats. $$$P <0.001 and $P <0.05 in comparision with control group. ###P <0.001 in comparision with STZ group. Data are expressed as Mean ± SD (n = 8), and analyzed by the One-way ANOVA and Tukey’s post hoc tests.
Abbreviations: Ctrl, control group; STZ, diabetic control group; CUR, curcumin; nCUR, nano-curcumin; HOMA-IR, homeostatic model assessment for insulin resistance.
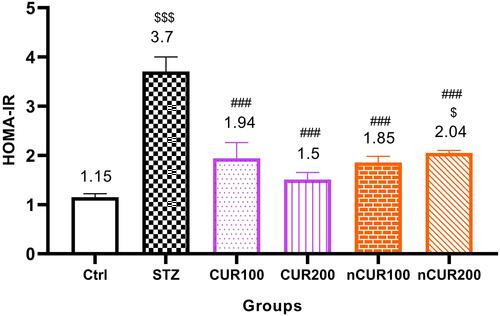
Figure 2 Effects of curcumin and nano-curcumin on FBS in studied rats. $$$P <0.001 and $$P <0.01 in comparision with control group. ###P <0.001 in comparision with STZ group. Data are expressed as Mean ± SD (n = 8), and analyzed by the One-way ANOVA and Tukey’s post hoc tests.
Abbreviations: Ctrl, control group; STZ, diabetic control group; CUR, curcumin; nCUR, nano-curcumin; FBS, fasting blood sugar.
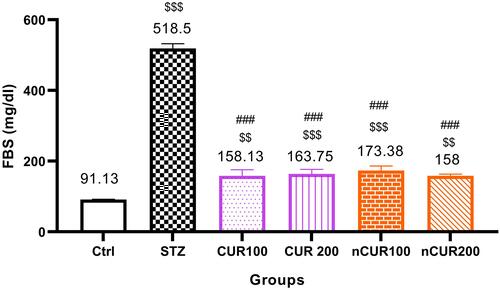
Figure 3 Effects of curcumin and nano-curcumin on serum levels of apelin in studied rats. $$$P <0.001 and $$P <0.01 in comparision with control group. ###P <0.001 and ##P <0.01 in comparision with STZ group. Data are expressed as Mean ± SD (n = 8), and analyzed by the One-way ANOVA and Tukey’s post hoc tests.
Abbreviations: Ctrl, control group; STZ, diabetic control group; CUR, curcumin; nCUR, nano-curcumin.
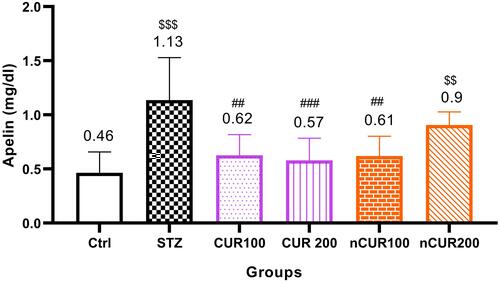
Figure 4 (A–E) Effects of curcumin and nano-curcumin on serum lipid profile levels in studied rats. Panel A, B, C, D and E show the average of serum levels of cholesterol, triglyceride, LDL, VLDL and HDL, respectively. $$$P <0.001 and $$P <0.01 in comparision with control group. ###P <0.00 in comparision with STZ group. ***P <0.001and *P <0.05 Nano-curcumin in comparision with curcumin group. Data are expressed as Mean ± SD (n = 8), and analyzed by the One-way ANOVA and Tukey’s post hoc tests.
Abbreviations: Ctrl, control group; STZ, diabetic control group; CUR, curcumin; nCUR, nano-curcumin; LDL, low-density lipoprotein; VLDL, very low-density lipoprotein; HDL, high-density lipoprotein.
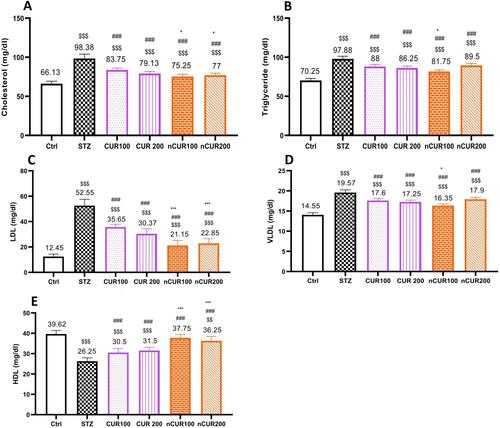
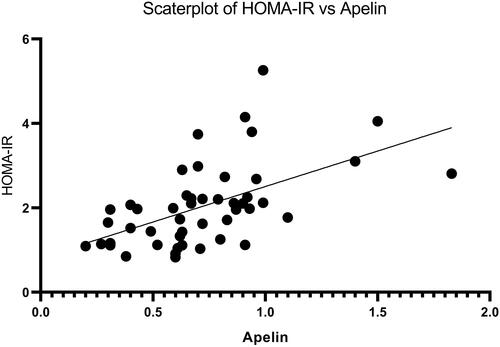
Figure 5 Correlation between insulin resistance and serum level of apelin in studied rats. The results were analyzed by Pearson correlation coefficient. N = 48.
Abbreviation: HOMA-IR, homeostatic model assessment for insulin resistance.