
Figures & data
Table 1 Clinical and Laboratory Characteristics of Participants in the CHARLS 2011 National Survey
Figure 1 ROC curve analysis of METS-IR and MetS for Chinese women in the CHARLS 2011 national survey.
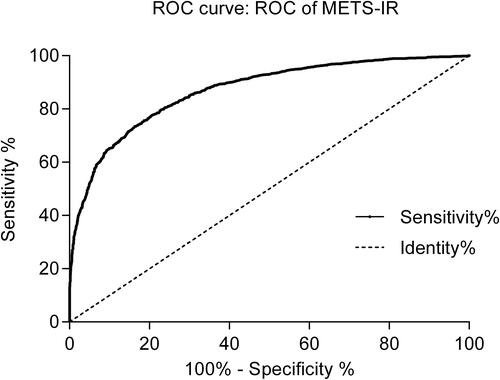
Table 2 Clinical and Laboratory Characteristics of Patients with KOA in the Present Study
Table 3 Comparative Analysis of METS-IR in the MetS-OA and nMetS-OA Groups After Adjusting for BMI
Table 4 Comparison of METS-IR in Patients with KOA with That of Participants in the CHARLS 2011 National Survey
Figure 2 METS-IR comparative analysis of MetS-OA and nMetS-OA groups. (A) METS-IR comparison between MetS-OA and nMetS-OA groups without adjusting for BMI. (B) METS-IR comparison between MetS-OA and nMetS-OA groups with BMI <25 kg/m2. (C) METS-IR comparison between MetS-OA and nMetS-OA groups with BMI 25–30 kg/m2. (D) METS-IR comparison between MetS-OA and nMetS-OA groups with BMI > 30 kg/m2.
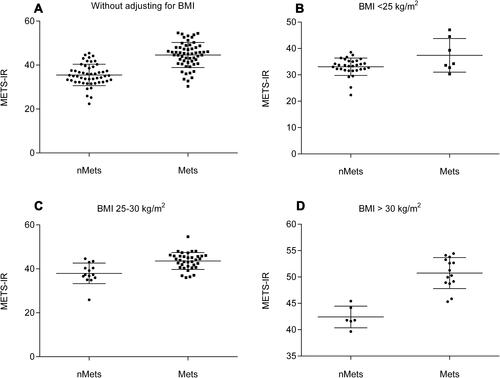
Table 5 Multiple Logistic Regression Analysis of CRP, ESR and Adipokines