Figures & data
Table 1 Characteristics of Patients in the Primary and Validation Cohorts
Table 2 Univariate Logistic Regression Analysis of Factors Relating to Digestive Carcinomas in the Primary Cohort
Table 3 Multivariate Logistic Regression Analysis of Factors Relating to Digestive Carcinomas in the Primary Cohort
Figure 1 Nomogram developed on the basis of the primary cohort, with sex, age, insulin use, and BMI incorporated.
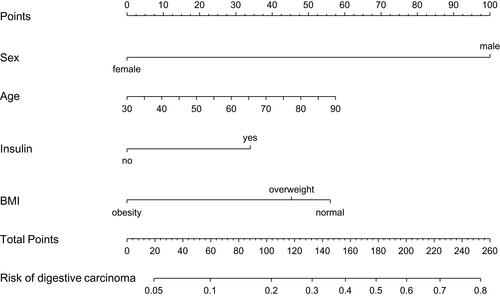
Figure 2 Calibration curves for the nomogram in the primary cohort. The blue dotted line represents the entire cohort (n=655), and the red solid line is the result after bias-correction by bootstrapping (1000 repetitions), indicating nomogram performance.
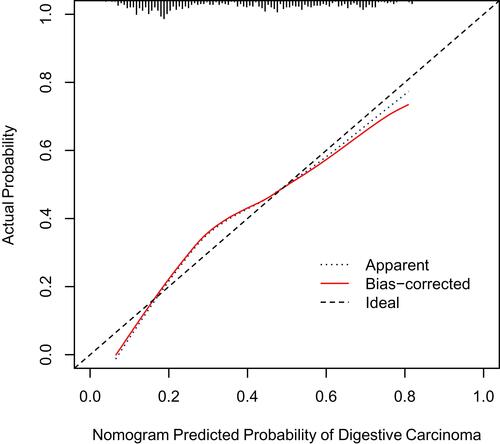
Figure 3 Calibration curves for the nomogram in the validation cohort. The blue dotted line represents the entire cohort (n=275), and the red solid line is the result after bias-correction by bootstrapping (1000 repetitions), indicating nomogram performance.
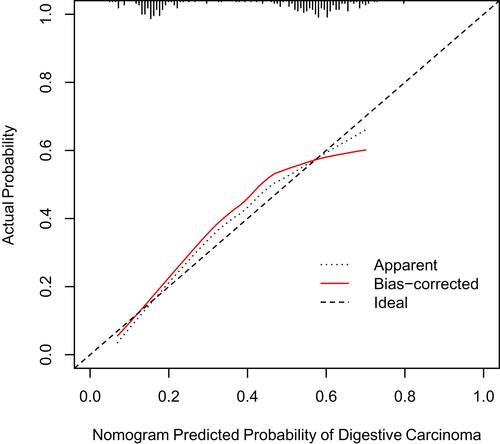
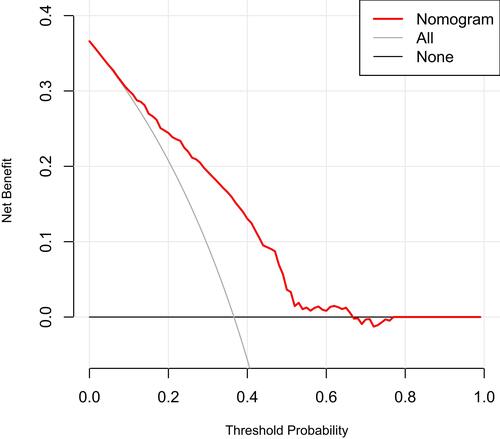
Figure 4 Decision curve analysis for the nomogram.