107
Views
5
CrossRef citations to date
0
Altmetric
Original Research

Obesity of G2e3 Knockout Mice Suggests That Obesity-Associated Variants Near Human G2E3 Decrease G2E3 Activity

ORCID Icon, , , , ORCID Icon, ORCID Icon, , & ORCID Icon show all
Pages 2641-2652 | Published online: 27 Jul 2020

Figures & data

Figure 1 Disruption of the G2e3 gene.

Notes: (A) G2e3-deficient mice were generated from OmniBank ES cell clone OST GST_3673_G2 which contains a gene trapping vector insertion in the first intron of G2e3 (accession NM_001015099.1). Numbered rectangles represent the 15 exons; open rectangles represent noncoding, and closed rectangles represent coding, exon sequence. (B) G2e3 intron 1 sequence surrounding the vector insertion site. (C) RT-PCR analysis of G2e3 transcript using primers complimentary to exons 1 and 2 of the G2e3 gene. Endogenous G2e3 transcript was detected in the lung and thymus of WT mice. No endogenous G2e3 transcript was detected in KO mouse tissues. RT-PCR analysis using primers (Actin) complimentary to the mouse beta-actin gene (accession number M12481) was performed in the same reaction as an internal amplification control.

Abbreviations: LTR, long terminal repeat; SA, splice acceptor sequence; IRES, internal ribosomal entry site; βGEO, translational fusion of the beta-galactosidase gene and the neomycin phosphotransferase gene; pA, polyadenylation sequence; PGK, phosphoglycerate kinase-1 promoter; BTK-SD, Bruton tyrosine kinase splice donor sequence; RT-PCR, reverse transcription-polymerase chain reaction; WT, wild-type; KO, knockout; M, PCR product size markers.

Figure 1 Disruption of the G2e3 gene.Notes: (A) G2e3-deficient mice were generated from OmniBank ES cell clone OST GST_3673_G2 which contains a gene trapping vector insertion in the first intron of G2e3 (accession NM_001015099.1). Numbered rectangles represent the 15 exons; open rectangles represent noncoding, and closed rectangles represent coding, exon sequence. (B) G2e3 intron 1 sequence surrounding the vector insertion site. (C) RT-PCR analysis of G2e3 transcript using primers complimentary to exons 1 and 2 of the G2e3 gene. Endogenous G2e3 transcript was detected in the lung and thymus of WT mice. No endogenous G2e3 transcript was detected in KO mouse tissues. RT-PCR analysis using primers (Actin) complimentary to the mouse beta-actin gene (accession number M12481) was performed in the same reaction as an internal amplification control.Abbreviations: LTR, long terminal repeat; SA, splice acceptor sequence; IRES, internal ribosomal entry site; βGEO, translational fusion of the beta-galactosidase gene and the neomycin phosphotransferase gene; pA, polyadenylation sequence; PGK, phosphoglycerate kinase-1 promoter; BTK-SD, Bruton tyrosine kinase splice donor sequence; RT-PCR, reverse transcription-polymerase chain reaction; WT, wild-type; KO, knockout; M, PCR product size markers.

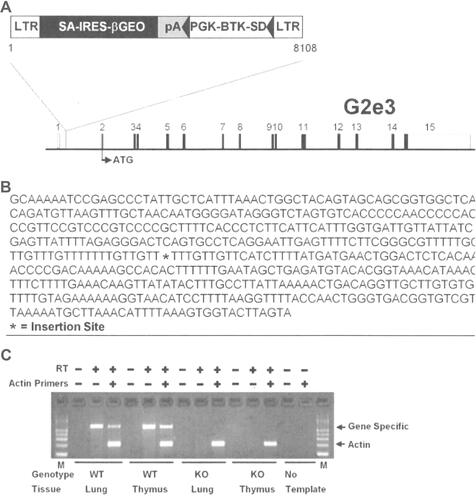
Table 1 Normalized Body Composition Data for G2e3 KO Mice

Table 2 Normalized Body Composition Data for Prkd1 KO Mice

Figure 2 G2e3 KO mice, but not Prkd1 KO mice, are obese during high-throughput phenotypic screening.

Notes: (A) Histogram of normalized % body fat for 3651 KO lines maintained on chow diet. Body composition analyses performed by DEXA on 14-week-old male mice fed chow diet from weaning were used to calculate normalized % body fat for each KO line, as described in Materials and Methods. Solid points indicate actual numbers of KO lines. Curved line shows the calculated curve; the range for 1 and 2 SD from the mean is indicated by lines located below the curve, and the mean values for the G2e3 and Prkd1 KO mouse lines are indicated by arrows shown above the curve. (B) Histogram of normalized % body fat for 2463 KO lines maintained on HFD. Body composition analyses performed by QMR on 11-week-old male mice fed 45% HFD from weaning were used to calculate normalized % body fat for each KO line, as described in Materials and Methods. Solid points indicate actual numbers of KO lines. Curved line shows the calculated curve; the range for 2 SD from the mean is indicated by lines located below the curve, and the values for the G2e3 and Prkd1 KO mouse lines are indicated by arrows shown above the curve.

Abbreviations: DEXA, dual-energy X-ray absorptiometry; HFD, high-fat diet; KO, knockout; QMR, quantitative magnetic resonance; SD, standard deviation.

Figure 2 G2e3 KO mice, but not Prkd1 KO mice, are obese during high-throughput phenotypic screening.Notes: (A) Histogram of normalized % body fat for 3651 KO lines maintained on chow diet. Body composition analyses performed by DEXA on 14-week-old male mice fed chow diet from weaning were used to calculate normalized % body fat for each KO line, as described in Materials and Methods. Solid points indicate actual numbers of KO lines. Curved line shows the calculated curve; the range for 1 and 2 SD from the mean is indicated by lines located below the curve, and the mean values for the G2e3 and Prkd1 KO mouse lines are indicated by arrows shown above the curve. (B) Histogram of normalized % body fat for 2463 KO lines maintained on HFD. Body composition analyses performed by QMR on 11-week-old male mice fed 45% HFD from weaning were used to calculate normalized % body fat for each KO line, as described in Materials and Methods. Solid points indicate actual numbers of KO lines. Curved line shows the calculated curve; the range for 2 SD from the mean is indicated by lines located below the curve, and the values for the G2e3 and Prkd1 KO mouse lines are indicated by arrows shown above the curve.Abbreviations: DEXA, dual-energy X-ray absorptiometry; HFD, high-fat diet; KO, knockout; QMR, quantitative magnetic resonance; SD, standard deviation.

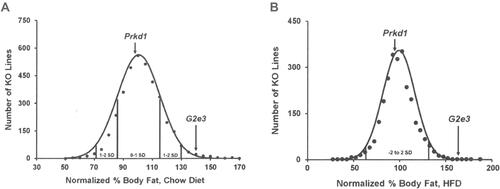
Table 3 Serum Chemistries from G2e3 and Prkd1 KO Mice

Figure 3 Impaired OGTT in G2e3, but not Prkd1, KO mice.

Notes: (A) Glucose excursions, and (B) 0 min and 30 mins insulin levels, from OGTTs performed on HFD-fed male G2e3 KO mice (n=6) and their WT littermates (n=4) at 14 weeks of age. (C) Glucose excursions, and (D) 0 min and 30 mins insulin levels, from OGTTs performed on HFD-fed male Prkd1 KO mice (n=4) and their WT littermates (n=4) at 14 weeks of age. Glucose AUC for G2e3 KO mice different from WT littermates, P<0.05.

Abbreviations: AUC, area under the curve; OGTT, oral glucose tolerance test; HFD, high-fat diet; KO, knockout; WT, wild-type.

Figure 3 Impaired OGTT in G2e3, but not Prkd1, KO mice.Notes: (A) Glucose excursions, and (B) 0 min and 30 mins insulin levels, from OGTTs performed on HFD-fed male G2e3 KO mice (n=6) and their WT littermates (n=4) at 14 weeks of age. (C) Glucose excursions, and (D) 0 min and 30 mins insulin levels, from OGTTs performed on HFD-fed male Prkd1 KO mice (n=4) and their WT littermates (n=4) at 14 weeks of age. Glucose AUC for G2e3 KO mice different from WT littermates, P<0.05.Abbreviations: AUC, area under the curve; OGTT, oral glucose tolerance test; HFD, high-fat diet; KO, knockout; WT, wild-type.

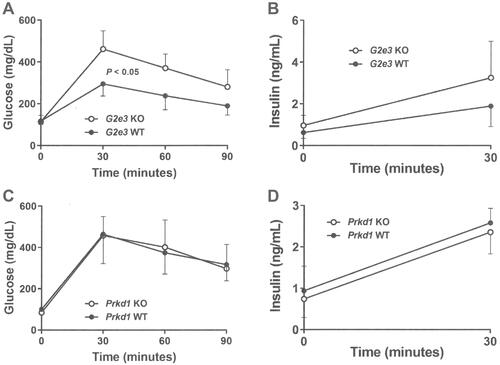
Table 4 Systolic Blood Pressure in G2e3 and Prkd1 KO Mice