
Figures & data
Table 1 Descriptive Characteristics of Type 2 Diabetes Mellitus Patients by Incidence of CHE
Table 2 Descriptive Statistics of Type of Household Expenditure by Socioeconomic Status
Table 3 Incidence and Intensity of CHE for Type 2 Diabetes Mellitus Care by Socioeconomic Status
Table 4 Results of Multivariate Logistic Regression of Determinants of Incidence of CHE for Type 2 Diabetes Mellitus at the 40% of CTP Threshold, Iran, 2019
Table 5 Results of Relative Concentration Index and Slope Index of Inequality for Incidence of CHE Among Patients with Type 2 Diabetes Mellitus
Figure 1 Concentration curve for incidence of CHE for type 2 diabetic care in different CTP thresholds.
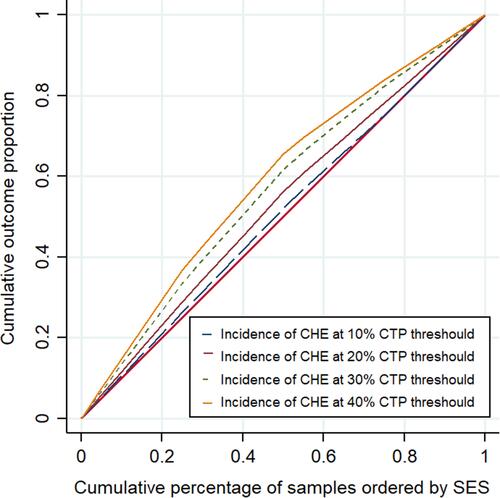
Table 6 Results of Decomposition Analysis of CHE Among Type 2 Diabetes Mellitus Patients