Figures & data
Table 1 Demographic and Clinical Characteristics of Study Participants
Table 2 Echocardiographic Characteristics of Study Participants
Figure 1 Differences in means with 95% CI for selected echocardiographic parameters.
Abbreviations: MHNW, metabolically healthy, normal weight; MHO, metabolically healthy obese; MUNW, metabolically unhealthy, normal weight; MUO, metabolically unhealthy obese; LV, left ventricle; CI, confidence interval.
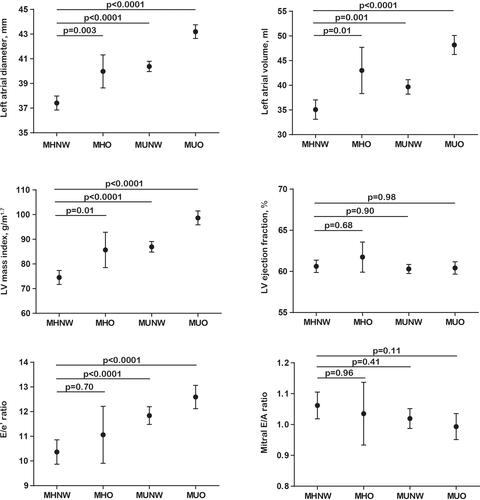
Table 3 Multivariable-Adjusted Regression Models for Echocardiographic Parameters
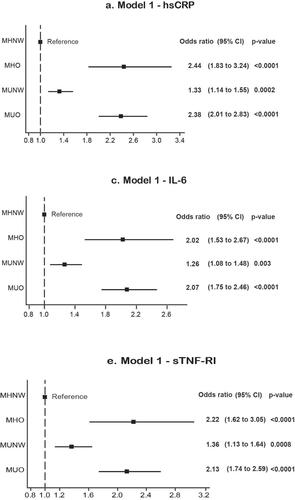
Figure 2 Forest plots of odds ratios and 95% CI for inflammatory biomarkers. Model 1 – age and sex adjusted. Odds ratios shown are for a 1-SD increment.
Abbreviations: MHNW, metabolically healthy, normal weight; MHO, metabolically healthy obese; MUNW, metabolically unhealthy, normal weight; MUO, metabolically unhealthy obese; CI, confidence interval.