Figures & data
Table 1 Physiological Characteristics of Canagliflozin-Treated Mice
Figure 1 Changes in the body weight and biological characteristics of canagliflozin-treated mice. (A) Weekly changes in the body weight of mice in each group. (B) Fat mass, lean mass, and body weight of mice in each group detected using MRI analysis performed on week 8 of treatment. The data are expressed as the mean ± SEM. *p<0.05 vs control. N=5 for each group.
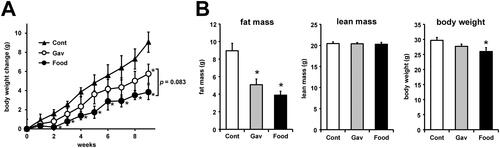
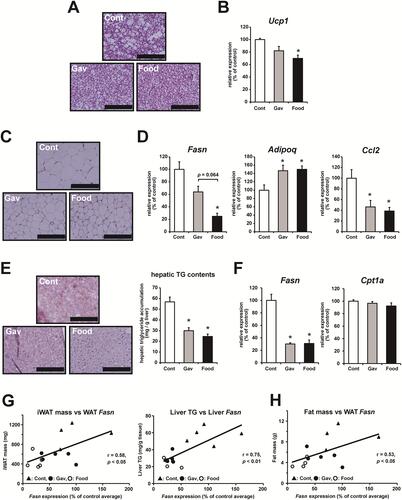
Figure 2 Analysis of BAT, WAT, and liver tissue isolated from mice treated with or without canagliflozin. (A) Hematoxylin and eosin (H&E) staining of BAT isolated from mice in each group. Scale bar = 200 μm. (B) The relative mRNA expression of Ucp1 in BAT of mice in each group. (C) H&E staining of WAT isolated from mice in each group. Scale bar = 200 μm. (D) Relative mRNA expression of Fasn, Adipoq, and Ccl2 in WAT isolated from mice in each group. (E) Oil Red O staining and triglyceride (TG) content of liver tissue isolated from mice in each group. Scale bar = 200 μm. (F) Relative mRNA expression of Fasn and Cpt1a in the liver tissues from mice in each group. (G) Correlation between inguinal WAT (iWAT) mass and WAT Fasn expression (left) and liver triglyceride levels and liver Fasn expression (right). (H) Correlation between the total fat mass detected using MRI analysis and WAT Fasn expression. For (G) and (H), the correlation coefficients were calculated based on Pearson’s correlation. The data are expressed as the mean ± SEM. *p<0.05 vs control. N=4–5 for each group.