Figures & data
Table 1 Clinicopathological Features of These 13 MSL Patients
Figure 1 Distribution of the MSL adipose tissues and image examinations. (A) Photographs of the clinical phenotype in these 13 MSL patients, and adipose tissue accumulated in the nuchal region, upper thorax, both upper arms, shoulders, abdomen, and the back in P1 to P6 and P13 patients, in the nuchal region and shoulders adipose tissues in P7, P8, P9, and P12 patients, and in the nuchal region in P10 and P11 patients. (B) MSL clinical classification according to the adipose tissue distribution. (C) Images of adipose tissue accumulation. The CT image data shows that abdomen adipose tissues only occur in the subcutaneous but not visceral locations in P1 to P6 and P13 patients, and CT images of the adipose tissues in the nuchal region and the anterior and posterior neck in P8 and P9 patients and MRI in P11 and P12 patients.
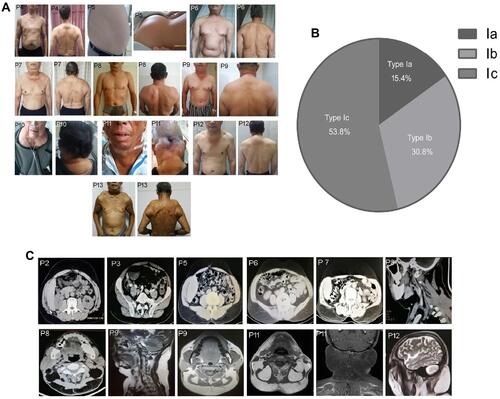
Table 2 Altered Metabolic and Endocrinic Parameters in These 13 MSL Patients
Figure 2 Isolation and characterization of hADSCs and ATLLM from MSL patients. (A) Immunohistochemistry. Expression of the UCP-1 protein was assessed in the ATLLM from MSL SATs, control SATs, and PATs. (B) qRT-PCR. The level of UCP-1 mRNA was detected in the ATLLM from MSL SATs (n = 6) and control SATs (n = 6) and PATs (n = 4). (C) qRT-PCR. The level of UCP-1 mRNA in the induced mature adipocytes with different concentration isoprenaline stimulation in MSL SATs (n = 6) and control SATs (n = 6) and PATs (n = 4). (D) qRT-PCR. The expression of the white and brown adipose markers in induced mature adipocytes from the MSL (n = 6) and control (n = 6). Representative blots are shown and the data is represented by the mean plus or minus SEM from 3 experiments. **P< 0.01 vs PATs of control; ##P < 0.01 vs 0 μM isoprenaline stimulation of control PATs; ΔP< 0.05, ΔΔP< 0.01 vs control.
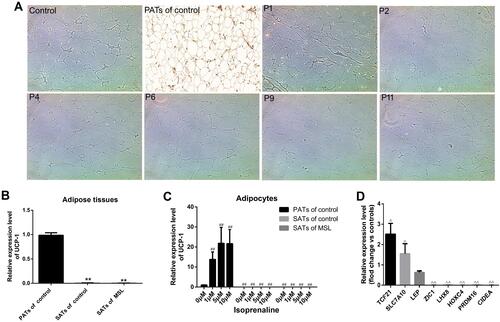
Figure 3 Sanger histogram of the CBLB c.197A>T heterozygous mutation in P2, P4, P6, and P9 patients. CBLB protein sequence and Conversation analysis of the CBLB p.Q66. The genomic DNA was extracted from the blood samples of all 13 MSL patients and 343 unrelated controls for the Sanger DNA sequence. (A–D) Sanger sequencing. The CBLB c.197A>T heterozygous mutation was verified in P2, P4, P6, and P9 patients, (E) not in any of the 343 unrelated controls. (F) The CBLB p.Q66L heterozygous mutation occurs in the “4H” functional domain within the TKB domain. (G) CBLB p.Q66 was the highly conserved site in 98 vertebrates analyzed with the UCSC software.
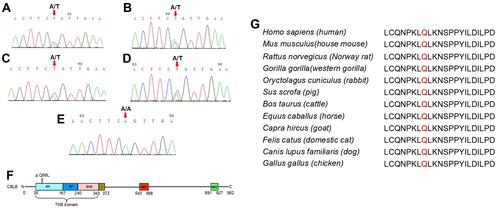
Figure 4 Confirmation of the ATLLM as a classic white adipose tissue with low CBLB expression in MSL. (A) H&E staining. The control SATs and PATs and MSL The SATs were subjected to tissue processing and staining for H&E. The data showed that there is no difference in either adipocyte size or morphology in the control and MSL SATs; however, there were abundant fibers in MSL SATs and smaller adipocyte size in control PATs. (B) Immunohistochemistry. The tissue sections were analyzed immunohistochemically for CBLB expression in the control, non-CBLB mutation (P1 and P11 patients), and the CBLB mutation (P2, P4, P6, and P9 patients). Strong expression of CBLB in controls and in non-CBLB mutation MSL patients, but there was low expression in CBLB mutation patients.
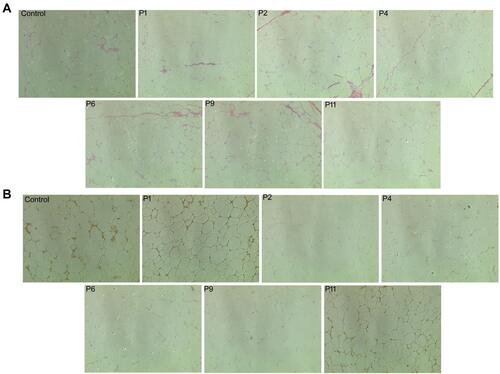
Figure 5 Subcellular localization of the wt- and mut-CBLB proteins. The HEK293 cells were infected with LV-NC, LV-wt-CBLB, or LV-mut-CBLB and viewed under a fluorescence microscope. The subcellular localization of the CBLB protein in LV-NC occurred in the cytoplasm and nucleus, but wt-and mut-CBLB proteins were found in the cytoplasm only.
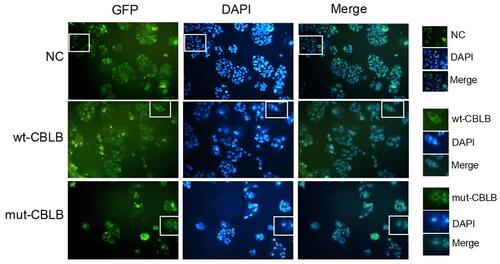
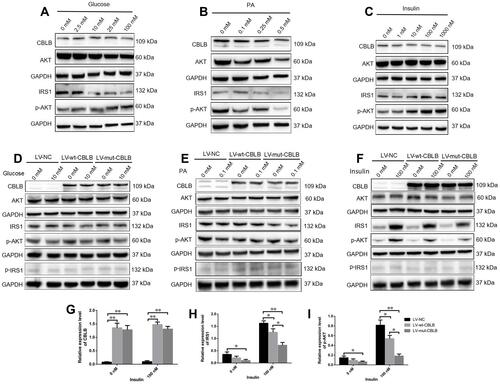
Figure 6 Mutated CBLB suppression of the IRS1-PI3K-AKT pathway activity. The hADSCs were treated with different concentrations of (A) glucose, (B) PA, or (C) insulin for 24 hours and then subjected to a Western blot analysis. The hADSCs were grown and infected with LV-NC, LV-wt-CBLB, or LV-mut-CBLB for 72 hours and then were treated with (D) 10nM glucose, (E) 0.1 nM PA, or (F–I) 100 nM insulin for 24 hours and then were subjected to a Western blot. Representative blots are shown and the data is summarized as the mean plus or minus SEM (n=3 experiments). *P< 0.05 and **P< 0.01.