Figures & data
Figure 1 The flow chart presents the entire process of patient follow-up, data collection and statistical analysis in this study.
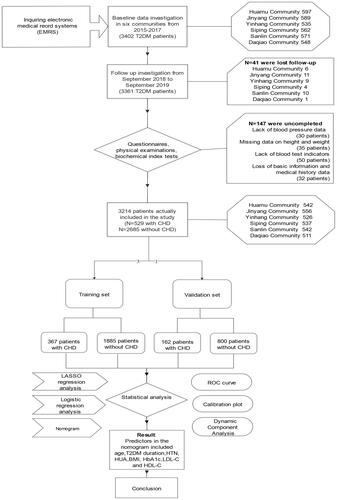
Table 1 Characteristics of the Participants in Different Groups
Table 2 Coefficients and Lambda.min Value of the LASSO Regression Based on the Training Set
Table 3 Model Established by Logistic Regression Analysis Based on the Training Set
Figure 2 Demographic and clinical feature selection using the LASSO binary logistic regression model in T2DM patients with CHD based on the training set.
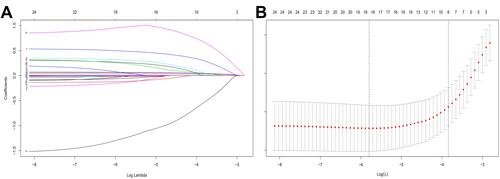
Figure 3 Developed nomogram for CHD.

Table 4 C-Index in the Array Based on Training Set and Validation Set
Figure 4 The pooled AUC of the ROC curve.
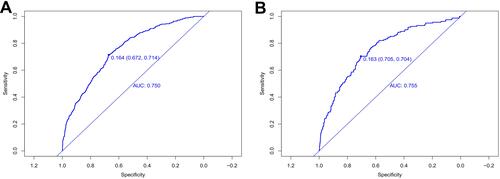
Figure 5 The calibration curves of the CHD incidence risk prediction in the array.
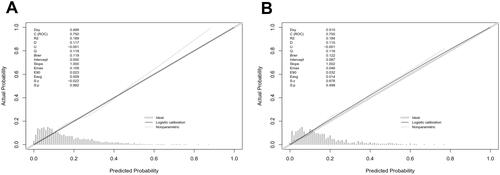
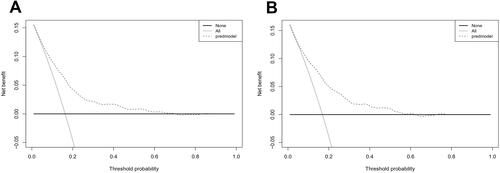
Figure 6 Decision curve analysis for the incidence risk nomogram of CHD.