Figures & data
Table 1 Demographic characteristics of the study population (N = 634)
Figure 1 Proportion of patients rating their painful diabetic peripheral neuropathy as mild, moderate, and severe.
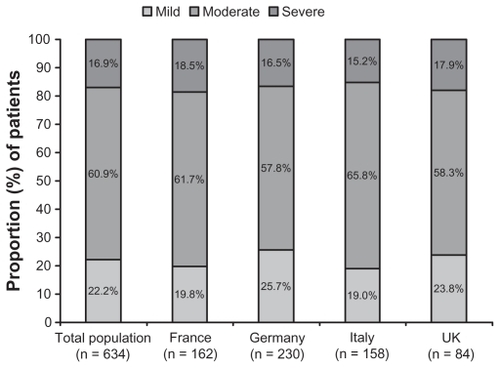
Table 2 Physician-reported versus patient-reported severity of painful diabetic neuropathy as a condition (weighted kappa coefficient = 0.43; 95% confidence interval 0.37, 0.48)
Figure 2 Relationship between self-reported severity of painful diabetic peripheral neuropathy and the Brief Pain Inventory Severity Indices.
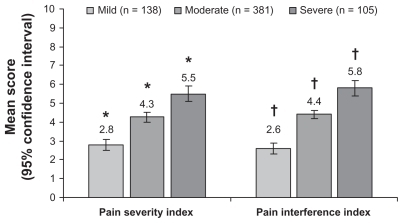
Figure 3 Relationship between self-reported severity of painful diabetic peripheral neuropathy and impact of pain on sleep.
Abbreviations: CI, confidence interval; pDPN, painful diabetic peripheral neuropathy.
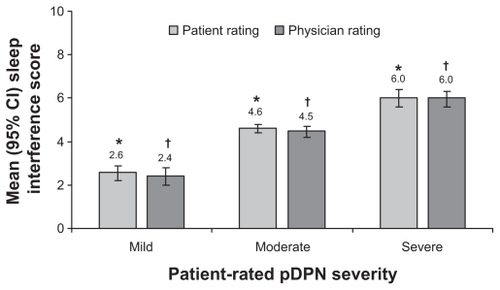
Figure 4 Relationship between self-reported severity of painful diabetic peripheral neuropathy and productivity assessed using the Work Productivity and Activity Impairment (WPAI) scale.Citation27
Abbreviation: CI, confidence interval.
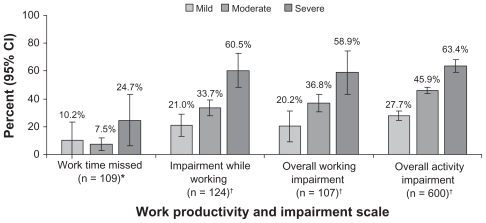
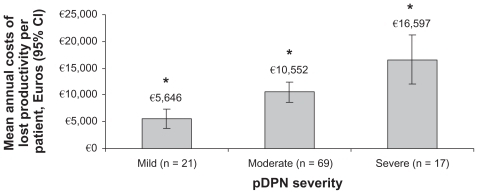
Figure 5 Relationship between self-reported severity of painful diabetic peripheral neuropathy and indirect costs resulting from lost productivity.
Abbreviation: pDPN, painful diabetic peripheral neuropathy.