Figures & data
Figure 1 Expression of EPB41L4A-AS1 and inflammatory factors in PBMC of T2DM patients, and experimental induction of PBMC and THP-1 cells by HG and high-fat conditions. (A) EPB41L4A-AS1 expression was decreased in the PBMC of T2MD patients compared with those of healthy individuals (GEO dataset GDS3875). (B–C) Expression of inflammatory factors IL-1β and IL-8 in PBMC of T2DM patients (GEO dataset GDS3874). (D) EPB41L4A-AS1 expression in PBMC after 55 mM HG + 250 μmol/L PA treatment for 12 h (n=3). (E) EPB41L4A-AS1 expression in THP-1 cells after 55 mM HG + 250 μmol/L PA treatment for 2–12 h (n=3). (F) IL-1β and IL-8 mRNA expression in PBMC after 55 mM HG + 250 μmol/L PA treatment for 12 h (n=3). (G) IL-1β and IL-8 mRNA expression in THP-1 cells after 55 mM HG + 250 μmol/L PA treatment for 6 h (n=3). (H) IL-1β and IL-8 protein expression in cell lysate of THP-1 cells after 55 mM HG + 250 μmol/L PA treatment for 6 h (n=3). (I) IL-8 protein expression in medium of THP-1 cells after 55 mM HG + 250 μmol/L PA treatment for 6 h (n=3). Data are shown as mean ± SD. *P<0.05, **P<0.01, ***P<0.001; Student’s t-test. HG, high glucose; NC, untreated; PA, palmitic acid.
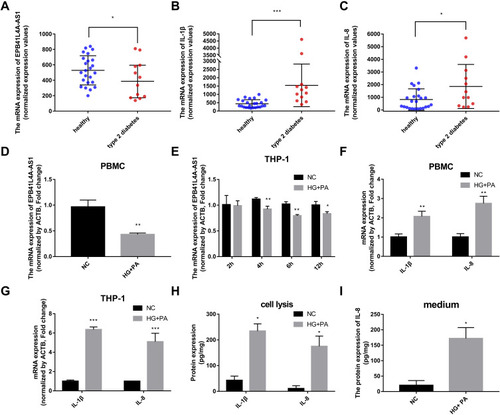
Figure 2 Expression of EPB41L4A-AS1 and inflammatory factors in PBMC and THP-1 cells induced by LPS. (A–C) Expression of EPB41L4A-AS1 and inflammatory factors IL-1β and IL-8 at different times (basal, 2, 4, 8, and 24 h) during LPS treatment of PBMC (GEO dataset GDS2856). (D) EPB41L4A-AS1 expression in PBMC after 1 μg/mL LPS treatment for 24 h (n=3). (E) EPB41L4A-AS1 expression in THP-1 cells after 1 μg/mL LPS treatment for 2–12 h (n=3). (F) IL-1β and IL-8 expression in PBMC after 1 μg/mL LPS treatment for 24 h (n=3). (G) IL-1β and IL-8 expression in THP-1 cells after 1 μg/mL LPS treatment for 6 h (n=3). (H) IL-1β and IL-8 protein expression in cell lysate of THP-1 cells after 1 μg/mL LPS treatment for 6 h (n=3). (I) IL-8 protein expression in medium of THP-1 cells after 1 μg/mL LPS treatment for 6 h (n=3). NC indicates negative control. Data are shown as mean ± SD. *P<0.05, **P<0.01, ***P<0.001; Student’s t-test.
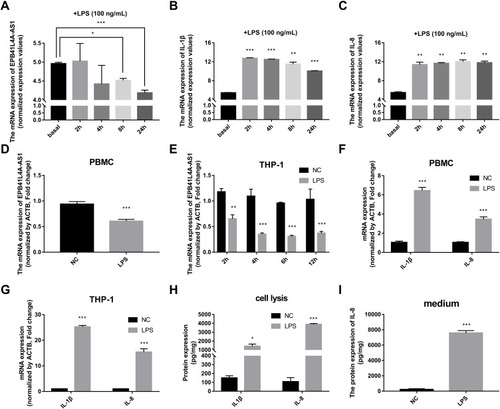
Figure 3 Expression of inflammatory factors was increased in EPB41L4A-AS1-knockdown cell lines under HG and high-fat conditions. (A) EPB41L4A-AS1 expression in shnc, shEPB41L4A-AS1-1, and shEPB41L4A-AS1-2 cells (n=3). (B) IL-1β expression in shnc, shEPB41L4A-AS1-1, and shEPB41L4A-AS1-2 cells (n=3). (C) IL-1β mRNA expression in shnc, shEPB41L4A-AS1-1, and shEPB41L4A-AS1-2 cells treated with 55 mM glucose plus different concentrations of PA (125, 250, 500 μmol/L) (n=3). (D) IL-8 mRNA expression in shnc, shEPB41L4A-AS1-1, and shEPB41L4A-AS1-2 cells after treatment with 55 mM glucose plus different concentrations of PA (125, 250, 500 μmol/L) (n=3). (E) IL-1β protein expression in cell lysate of shnc, shEPB41L4A-AS1-1, and shEPB41L4A-AS1-2 cells after 55 mM glucose plus 250 μmol/L PA treatment (n=3). (F–G) IL-8 protein expression in cell lysate and media of shnc, shEPB41L4A-AS1-1, and shEPB41L4A-AS1-2 cells after 55 mM glucose plus 250 μmol/L PA treatment (n=3). Data are shown as mean ± SD. *P<0.05, **P<0.01, ***P<0.001; Student’s t-test.
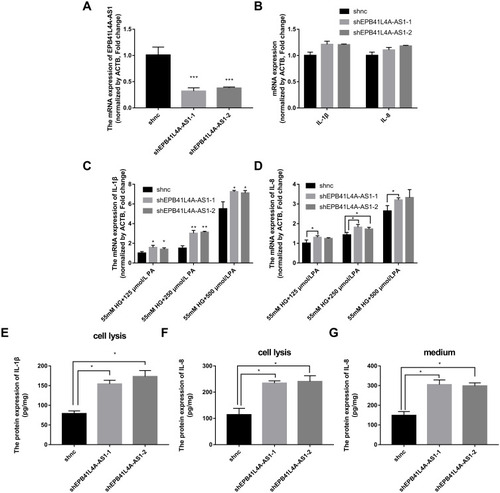
Figure 4 Expression of inflammatory factors was increased in EPB41L4A-AS1-knockdown cell lines under LPS treatment. (A–B) IL-1β and IL-8 mRNA expression in shnc, shEPB41L4A-AS1-1, and shEPB41L4A-AS1-2 cells after treatment with different concentrations of LPS (100 ng to 1 μg) for 6 h (n=3). (C–D) IL-1β and IL-8 protein expression in cell lysate of shnc, shEPB41L4A-AS1-1, and shEPB41L4A-AS1-2 cells after 200 ng/mL LPS treatment for 6 h (n=3). (E) IL-8 protein expression in media of shnc, shEPB41L4A-AS1-1, shEPB41L4A-AS1-2 cells after 200 ng/mL LPS treatment for 6 h (n=3). Data are shown as mean ± SD. *P<0.05, **P<0.01, ***P<0.001; Student’s t-test.
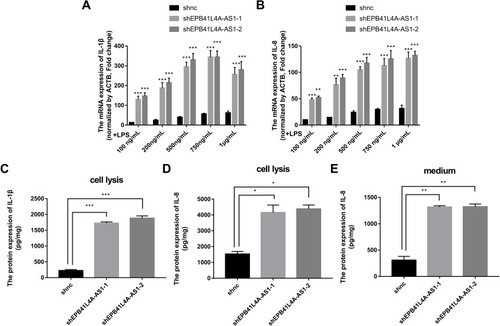
Figure 5 EPB41L4A-AS1 knockdown induced MYD88-mediated activation of the NF-κB pathway. (A) Expression of phospho-p65 and p65 in shnc, shEPB41L4A-AS1-1, and shEPB41L4A-AS1-2 cells without LPS treatment and with 200 ng/mL LPS treatment. (B) Immunofluorescence localization of phospho-p65 in shnc, shEPB41L4A-AS1-1, and shEPB41L4A-AS1-2 cells after 200 ng/mL LPS treatment. Bar represents 20 μm. (C) MYD88 expression in PBMC expression microarray (GDS3874) for T2DM patients. (D) MYD88 expression in expression microarray of human PBMC treated with LPS (GDS2856). (E–F) mRNA and protein expression of MYD88 in shnc, shEPB41L4A-AS1-1, and shEPB41L4A-AS1-2 cells after 200 ng/mL LPS treatment. (G–I) mRNA expression of MYD88, IL-1B, and IL-8 in shEPB41L4A-AS1-sinc and shEPB41L4A-AS1-siMYD88 cells after 200 ng/mL LPS treatment. (J) Expression of phospho-p65 and p65 in shEPB41L4A-AS1-sinc and shEPB41L4A-AS1-siMYD88 cells without LPS treatment and with 200 ng/mL LPS treatment. Data are shown as mean ± SD. *P<0.05, **P<0.01, ***P<0.001; Student’s t-test.
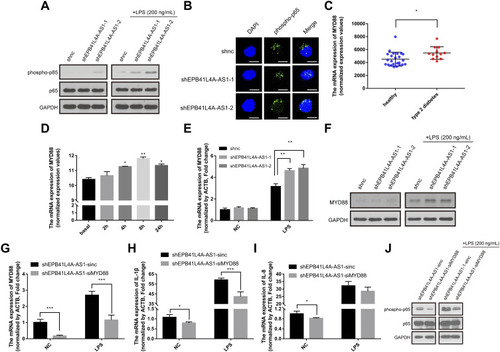
Figure 6 EPB41L4A-AS1 knockdown enhanced enrichment of H3K9me3 in the promoter of MYD88. (A) Location of CpG island in the MYD88 promoter region, from ENCODE database. (B) ChIP analysis of H3K9me3 enrichment in the promoter of MYD88 without LPS treatment (n=3). (C) ChIP analysis of H3K9me3 enrichment in the promoter of MYD88 with 200 ng/mL LPS treatment (n=3). (D) ChIP analysis of H3K27me3 enrichment in the promoter of MYD88 without LPS treatment (n=3). (E) ChIP analysis of H3K27me3 enrichment in the promoter of MYD88 with 200 ng/mL LPS treatment (n=3). Data are shown as mean ± SD. **P<0.01; Student’s t-test.
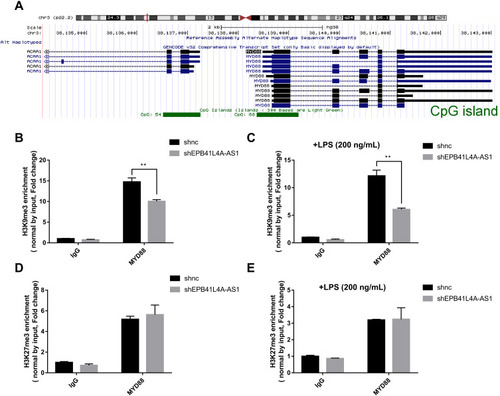
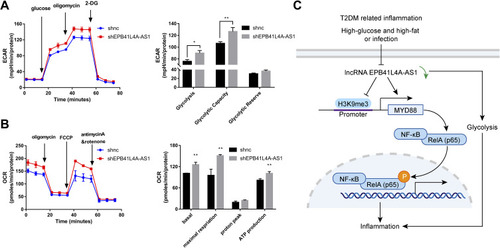
Figure 7 EPB41L4A-AS1 knockdown increased glycolysis and mitochondrial stress. (A) ECAR in shnc and shEPB41L4A-AS1 cells (n=3). (B) OCR in shnc and shEPB41L4A-AS1 cells (n=3). (C) Schematic model of MYD88-mediated activation of the NF-κB pathway by EPB41L4A-AS1 in T2DM-related inflammation. Data are shown as mean ± SD. *P<0.05, **P<0.01; Student’s t-test.