Figures & data
Figure 1 Sampling design to select participants (n=250).
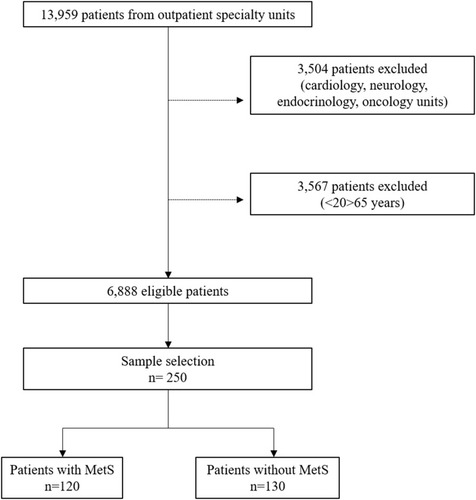
Table 1 Descriptive Characteristics of Men (n=77) Between 20 and 65 Years With and Without MetS
Table 2 Descriptive Characteristics of Women (n=173) Between 20 and 65 Years With and Without MetS
Table 3 Area Under the Receiver Operating Characteristics Curve, Optimal Cut-Off Points of the MetS Components in Men (n=77)
Figure 2 Area under the receiver operating characteristics curve of the parameters to predict MetS in men (n=77).
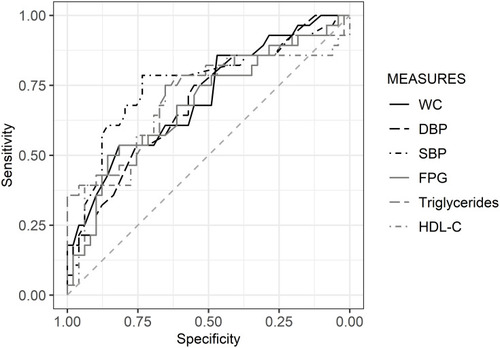
Table 4 Area Under the Receiver Operating Characteristics Curve, Optimal Cut-Off Points of the MetS Components in Women (n=173)
Figure 3 Area under the receiver operating characteristics curve of the parameters to predict MetS in women (n=173).
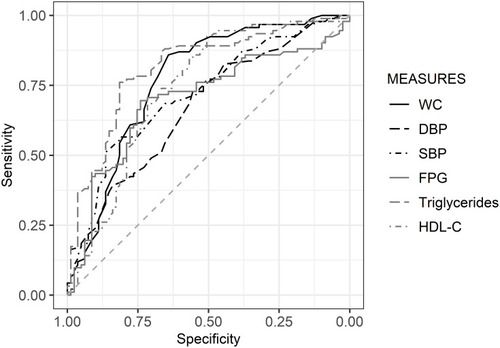
Table 5 Area Under the Receiver Operating Characteristics Curve and Cut-Off Points of the Indices Predicting MetS in Men (n=60) by Age Group
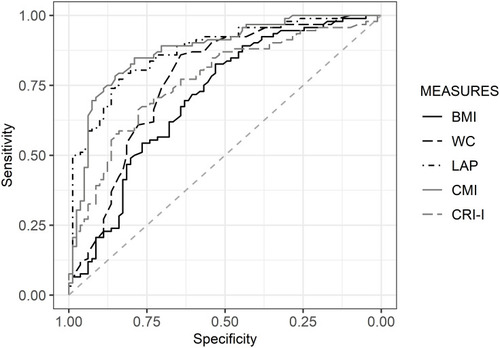
Figure 4 Area under the receiver operating characteristics curve of the anthropometric characteristics and lipid indices to predict MetS in men (n=60).
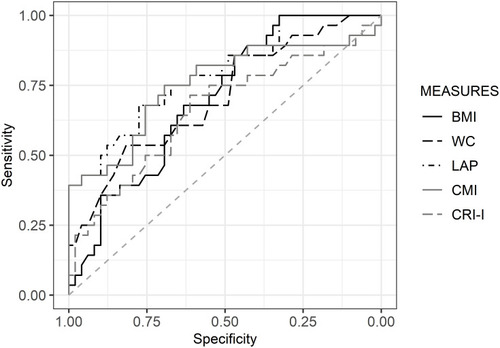
Table 6 Area Under the Receiver Operating Characteristics Curve and Cut-Off Points of the Indices Predicting MetS in Women (n=173) by Age Group
Figure 5 Area under the receiver operating characteristics curve of the anthropometric characteristics and lipid indices to predict MetS in women (n=173).