
Figures & data
Table 1 Patient Characteristics of the Participants in Different Age Group with or Without MS
Table 2 Logistic Regression Analysis for BMI and Testosterone
Figure 1 The One-way ANOVA of mean T levels between different numbers of measures that exceeds the cut-off values of MS components.
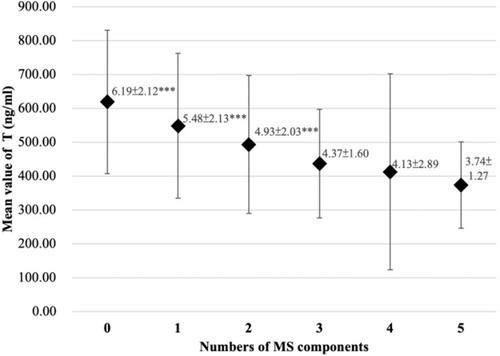
Table 3 Logistic Regression Analysis for BMI and Testosterone and MS in Different Age Group