Figures & data
Figure 1 Selection of trials for pooled analysis. Of the 61 clinical trials with available data, 19 placebo-controlled or comparator-controlled studies met the criteria for inclusion in the pooled analysis.
Figure 2 Mean treatment exposure. Cumulative duration of exposure (proportion of patients within each duration shown) and mean treatment exposure for the exenatide (166 days) and pooled comparator (171 days) groups.
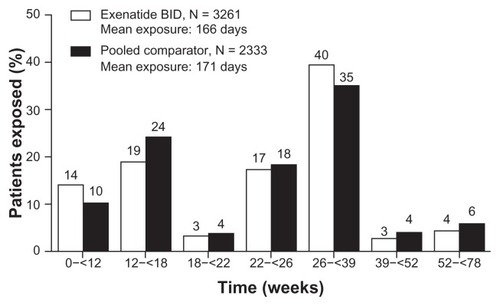
Table 1 Summary of treatment-emergent adverse events and discontinuations
Table 2 Summary of treatment-emergent adverse events by system organ class
Table 3 Frequent (≥5%) treatment-emergent adverse events
Table 4 Study drug-relatedTable Footnotea serious adverse events by preferred term
Figure 3 Incidence, recurrence, and duration of nausea and vomiting over time. Nausea and vomiting with exenatide twice daily 10 μg (4-week lead-in period with 5 μg exenatide twice daily, followed by dose increase to 10 μg twice daily for the duration of the trial; n = 2558), placebo (n = 1325), and insulin (n = 1008). (A) Occurrence and recurrence of nausea over time (grouped into 4-week intervals). (B) Occurrence and recurrence of vomiting over time. Each event is attributed to a defined period according to the event onset date, and recurrence of nausea/vomiting is defined as an event with onset during the defined period and any of the previous periods. Percentages are based on number of subjects who remained in the trial during the defined period. (C) Duration of nausea. (D) Duration of vomiting. The duration of the nausea/vomiting event is calculated as the resolution date (or the last participation date if event is ongoing at the time of study termination) minus the event onset date plus 1.
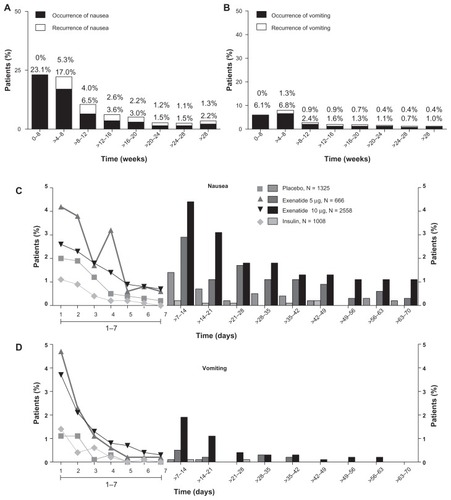
Figure 4 Incidence of hypoglycemia by treatment. Percentage of patients who experienced hypoglycemia (minor or major).
Abbreviations: RD, risk difference; Ex, exenatide; BID, twice daily; Ins, insulin; PBO, placebo; SFU, sulfonylurea. PBO + SFU or Ins refers to placebo with SFU or with background insulin.
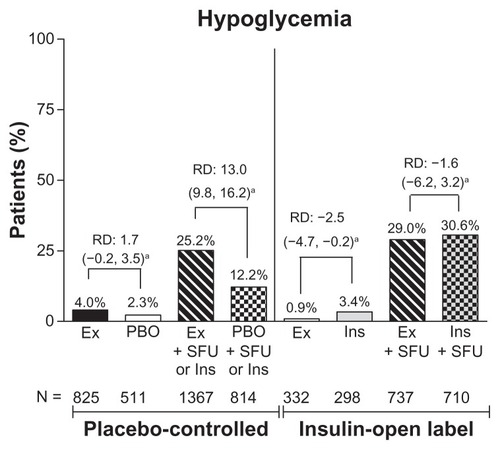
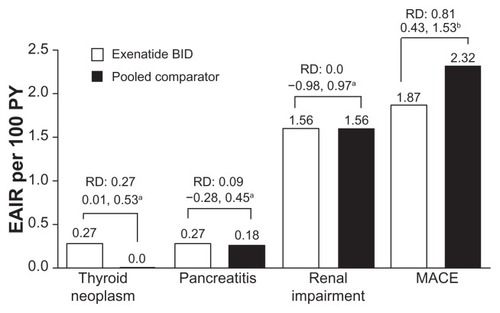
Figure 5 Adverse events of interest. Exposure-adjusted incidence rate and risk difference of thyroid neoplasm, pancreatitis, and renal impairment (exenatide twice daily n = 3261, pooled comparator n = 2333) and major adverse cardiac events analysis (n = 2316, n = 1629, respectively). Thyroid neoplasm includes benign neoplasm of thyroid gland and malignant thyroid neoplasm. Pancreatitis includes acute pancreatitis and chronic pancreatitis. Renal impairment includes renal failure. Major adverse cardiac events include stroke, myocardial infarction, cardiac mortality, acute coronary syndrome, and revascularization procedures.
Abbreviations: EAIR, exposure-adjusted incidence rate; BID, twice daily, MACE, major adverse cardiac events; PY, patient years.