
Figures & data
Table 1 Summary of Baseline Patient Characteristics
Figure 1 ROC curves for predicting the primary endpoint (all-cause mortality) for baseline NLR and PLR. The optimum cut-off values were NLR ≥ 2.76 (sensibility 69.2%, specificity 62.6%) and PLR ≥ 160.05 (sensibility 73.1%, specificity 47%).
Abbreviations: ROC, receiver operating characteristic; NLR, neutrophil-to-lymphocyte ratio; PLR, platelet-to-lymphocyte ratio.
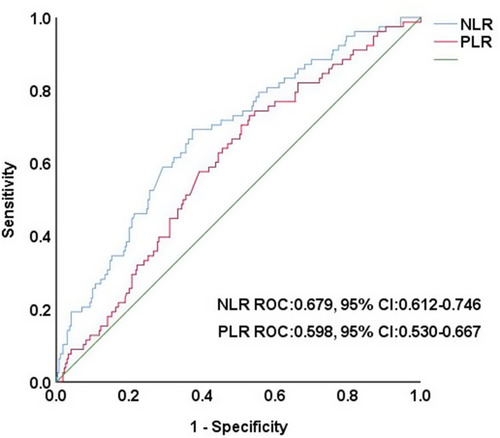
Figure 2 Kaplan–Meier analysis showing cumulative mortality according to the optimal cut off value. (A) Platelet-to-lymphocyte ratio (160.05). (B) Neutrophil-to-lymphocyte ratio (2.76).
Abbreviation: OS, overall survival.
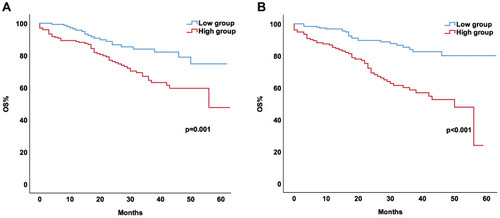
Table 2 Univariate and Multivariate Analyses of the Overall Survival of Patients with Diabetic Foot Ulcers Undergoing Amputations