Figures & data
Table 1 Frequency of Viral DNA According to BMI Categories
Figure 1 Identification of HAd36 DNA in 6% polyacrylamide gel stained with 0.3% AgNO3. (A) Lanes 1–6, negative samples for HAd36 and lanes 7–12, positive samples for HAd36. The PCR products correspond to an amplified fragment of 171 bp. (B) PCR products for β-actin, amplified fragment of 290 pb. M corresponds to the molecular marker of 50 bp. C+ indicates the positive control and N indicates the negative control.
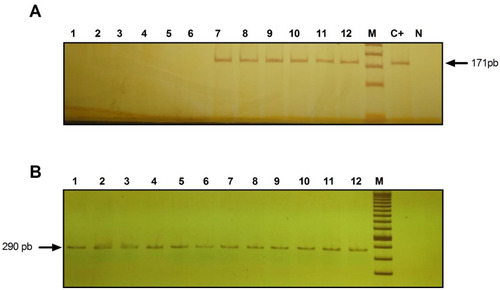
Table 2 Comparison of Clinical and Metabolic Characteristics According to BMI Categories and Viral DNA Positivity
Figure 2 Morphological analysis and distribution of adipose tissue from women who underwent abdominal lipectomy. (A) Distribution (%) of positive and negative samples for HAd36 in relation to the number of adipose cells per field. (B) Distribution (%) of positive and negative samples for HAd36 in relation with cell diameter. (C) Representative photograph of an adipose tissue sample positive for HAd36, showing greater cellularity and adipocytes of variable size. (D) Representative photograph of an adipose tissue sample negative for HAd36, showing a more homogeneous distribution in the number and size of adipocytes.
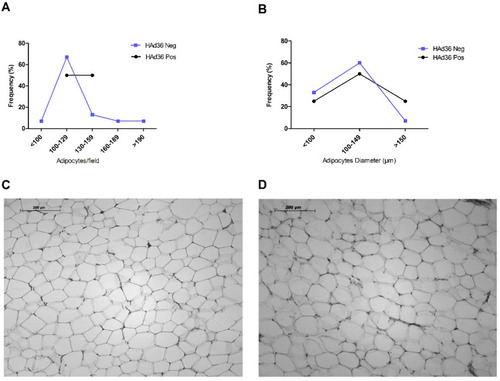
Figure 3 Morphological changes of subcutaneous adipose tissue from women subjected to abdominal lipectomy. (A) Frequency of fat cell hyperplasia in positive and negative women for HAd36. (B) Frequency of fat cell hypertrophy in positive and negative women for HAd36. The P value was calculated using Fisher’s exact test.
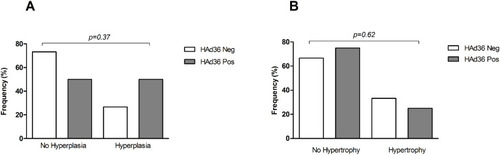
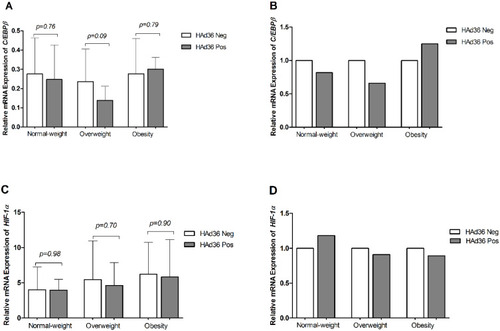
Figure 4 Relative mRNA expression of the C/EBPβ and HIF-1α genes is shown. (A, B) C/EBPβ mRNA expression between HAd36-positive and -negative samples by BMI category. (C, D) HIF-1α mRNA expression between HAd36-positive and -negative samples by BMI category. Relative expression analysis for each gene of interest was performed using 2−ΔCt (A and C) and 2−ΔΔCt (B and D) methods and β-actin was the reference gene. The P value was calculated using the Welch’s t-test.