Figures & data
Table 1 Primer Sequences in RT-qPCR
Figure 1 adMSC-derived exosomes reduce DN symptoms in model rats. (A) Round nanoparticles observed under the TEM; (B) diameter of the collected particles measured by NTA; (C) levels of exosome-specific surface biomarkers TSG101, CD9 and CD63 determined by Western blot analysis; (D) changes in physiological parameters in each group of rats (one-way ANOVA, *p < 0.05 vs Control; # p < 0.05 vs PBS); (E) mesangial hyperplasia in rat kidney tissues determined by PAS staining (one-way ANOVA, *p < 0.05 vs Control; # p < 0.05 vs PBS); (F) pathological changes in rat kidneys examined by HE staining (one-way ANOVA, *p < 0.01 vs Control; # p < 0.05 vs PBS), (G) protein level of the fibrosis-related marker Col. I in rat kidney determined by IHC staining (one-way ANOVA, *p < 0.05 vs Control; # p < 0.05 vs PBS); (H) viability of GMCs after different concentrations of exosomes (1 μg, 2 μg, 3 μg, 4 μg and 5 μg) or PBS treatment determined by the CCK-8 method (one-way ANOVA, *p < 0.05 vs Control); (I) IL-6 mRNA expression in GMCs determined by RT-qPCR (one-way ANOVA, *p < 0.01 vs NG; # p < 0.05 vs PBS); (J) proliferation ability of GMCs determined using the CCK-8 method (one-way ANOVA, *p < 0.01 vs NG; # p < 0.05 vs PBS). N = 10 in each group. Data were exhibited as mean ± SEM from three independent experiments. Representative images are provided.
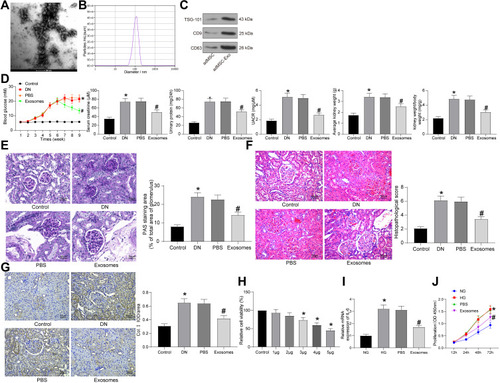
Figure 2 adMSC-derived exosomes exert functions by carrying miR-125a. (A) miR-125a expression in each group of exosomes determined by RT-qPCR (one-way ANOVA, compared to Exo-NC, ***p < 0.001); (B) changes in physiological parameters in each group of rats (one-way ANOVA, *p < 0.05 vs Control, # p < 0.05 vs PBS, & p < 0.05 vs Exo-NC); (C) mesangial hyperplasia in rat kidney tissues determined by PAS staining (one-way ANOVA, *p < 0.05 vs Control, # p < 0.05 vs PBS, & p < 0.05 vs Exo-NC); (D) pathological changes in rat kidneys examined by HE staining (one-way ANOVA, *p < 0.05 vs Control, # p < 0.05 vs PBS, & p < 0.05 vs Exo-NC), (E) protein level of the fibrosis-related marker Col. I in rat kidney determined by IHC staining (one-way ANOVA, *p < 0.05 vs Control, # p < 0.05 vs PBS, & p < 0.05 vs Exo-NC); (F) protein levels of Bax and Bcl-2 in rat kidney tissues determined by Western blot analysis (one-way ANOVA, *p < 0.05 vs Control, # p < 0.05 vs PBS, & p < 0.05 vs Exo-NC); (G) mRNA expression of Col. I and FN in HG-treated GMC cells determined by RT-qPCR (one-way ANOVA, *p < 0.05 vs Control, # p < 0.05 vs PBS, & p < 0.05 vs Exo-NC). N = 10 in each group. Data were exhibited as mean ± SEM from three independent experiments. Representative images are provided.
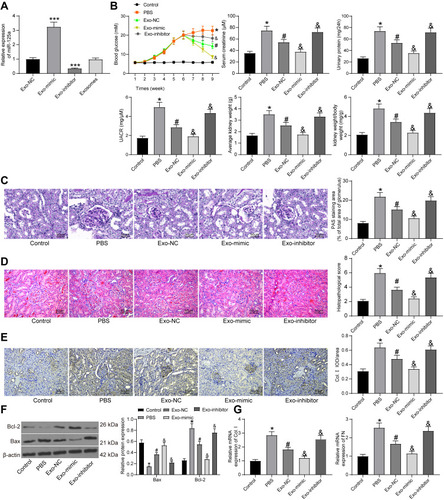
Figure 3 miR-125a directly binds to HDAC1. (A) putative binding sequence of miR-125a and HDAC1 predicted on miRwalk; (B) RT-qPCR and protein expression of HDAC1 in kidney tissues in DN rats and in GMCs determined by RT-qPCR and Western blot analysis (unpaired t test, **p < 0.01 vs Control; ## p<0.01,### p < 0.001 vs NG); (C) HDAC1 expression in HG-treated SV40-MES1 cells post miR-125a mimic/inhibitor/NC transfection determined using RT-qPCR and Western blot analysis (one-way ANOVA, **p < 0.01 vs NC); (D) binding relationship between miR-125a and HDAC1 validated by a dual-luciferase reporter gene assay (one-way ANOVA, *p < 0.05 vs NC). N = 10 in each group. Data were exhibited as mean ± SEM from three independent experiments.
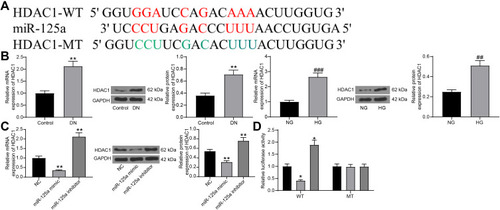
Figure 4 HDAC1 interacts with ET-1. (A) ET-1 was highly expressed in DN rats and HG-treated GMCs (unpaired t test, **p < 0.01 vs Control; ## p < 0.01 vs NG); (B) enrichment of ET-1 mRNA fragments in the compound pulled down by anti-HDAC1 or anti-IgG (unpaired t test, ***p < 0.001). N = 10 in each group. Data were exhibited as mean ± SEM from three independent experiments.
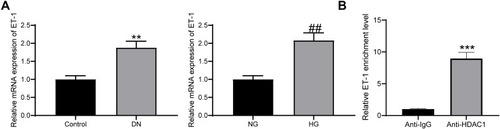
Figure 5 HDAC1 regulates ET-1 to promote DN progression. (A) HDAC1 expression in HG-treated GMCs after pcDNA-HDAC1 transfection determined by RT-qPCR (unpaired t test, ***p < 0.001); (B) ET-1 expression in each group of GMCs determined by RT-qPCR (one-way ANOVA, *p < 0.05 vs pcDNA; # p < 0.05 vs pcDNA-HDAC1 + siRNA-NC); (C) IL-6 expression in each group of GMCs determined by RT-qPCR (one-way ANOVA, *p < 0.05 vs pcDNA; # p < 0.05 vs pcDNA-HDAC1 + siRNA-NC); (D) proliferation of each group of cells determined by CCK-8 method (two-way ANOVA, *p < 0.05 vs pcDNA; # p < 0.05 vs pcDNA-HDAC1 + siRNA-NC). Data were exhibited as mean ± SEM from three independent experiments.
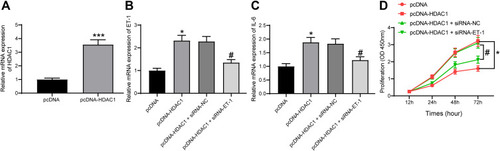
Figure 6 adMSC-derived exosomal miR-125a protects DN through inhibiting the HDAC1/ET1 axis. (A) levels of blood glucose, serum creatinine and 24-h urinary protein in each group of rats (unpaired t test, *p < 0.05); (B) expression of HDAC1 and ET-1 in the kidney tissues of rats determined by RT-qPCR (two-way ANOVA, *p < 0.05 vs Exo-mimic + LV-NC); (C) mesangial hyperplasia in rat kidney tissues determined by PAS staining (unpaired t test, *p < 0.05); (D) changes in physiological parameters in each group of rats (unpaired t test, *p < 0.05); pathological changes in rat kidneys examined by HE staining (unpaired t test, *p < 0.05), (E) protein level of the fibrosis-related marker Col. I in rat kidney determined by IHC staining (unpaired t test, *p < 0.05); (F) mRNA expression of HDAC1, ET-1, Col. I and FN in cells determined by RT-qPCR (two-way ANOVA, *p < 0.05 vs Exo-mimic + LV-NC); (G) protein levels of Bax and Bcl-2 in cells determined by Western blot analysis (unpaired t test, *p < 0.05). N = 10 in each group. Data were exhibited as mean ± SEM from three independent experiments. Representative images are provided.
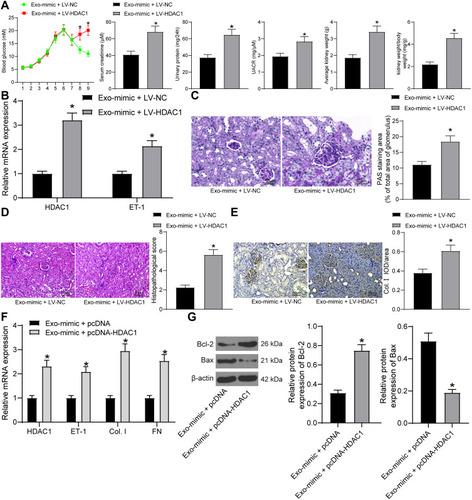
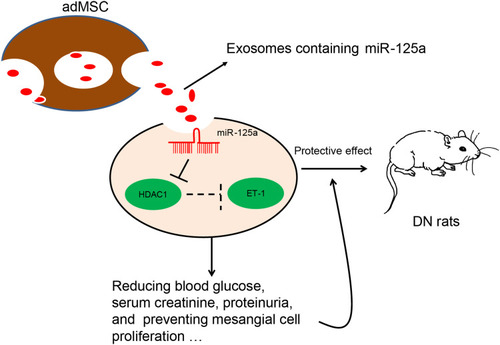
Figure 7 A diagram for molecular mechanism. adMSC-derived exosomes carry miR-125a to decrease the levels of blood glucose, serum creatinine and urinary protein in DN model rats. In HG-treated GMCs, exosomal miR-125a inhibits cell proliferation and expression of fibrosis-related factors to alleviate DN progression. miR-125a directly binds to HDAC1, which interacts with ET-1 to up-regulate ET-1 expression. Down-regulation of HDAC1 and ET-1 is involved in the miR-125a-mediated kidney protective events.