Figures & data
Table 1 Baseline Characteristics of the Study Population
Table 2 Multivariate Logistic Regression Analysis Showing Independent Predictors of CKD
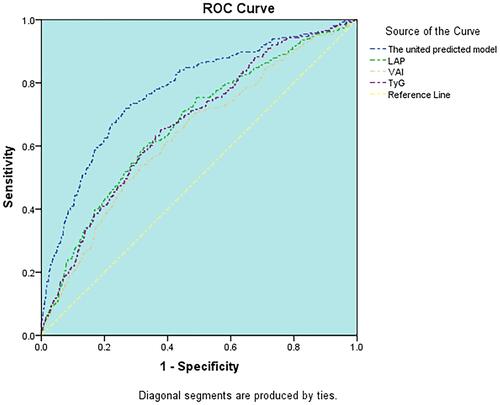
Table 3 The Areas Under ROC Curve (AUC), Sensitivity and Specificity by the Optimized Cut-off Points for Novel Indices in Predicting CKD
Figure 1 ROC curve analysis of the value of TyG, LAPI, VAI, united predicted model for predicting CKD in males.
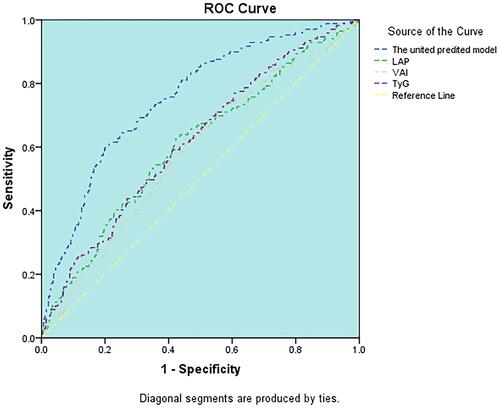
Figure 2 ROC curve analysis of the value of TyG, LAPI, VAI, united predicted model for predicting CKD in females.