Figures & data
Table 1 Custom Primer Sequences for Rat Gene Transcript Analyses
Figure 1 The distribution and content of CD68-positive macrophages in diabetic wounds. (A) The relative quantitation of CD68 mRNA expression. (B) Anti-CD68 immunohistochemistry images of wound beds at day 14. Scale bar = 50 μm. (C) Anti-CD68 immunofluorescent assays for the survived adipose tissue of AFG or AFG+MD rats at day 14 post surgery (the white arrowhead shows the lipid droplets of adipose tissue). Scale bar = 50 μm. * P<0.05.
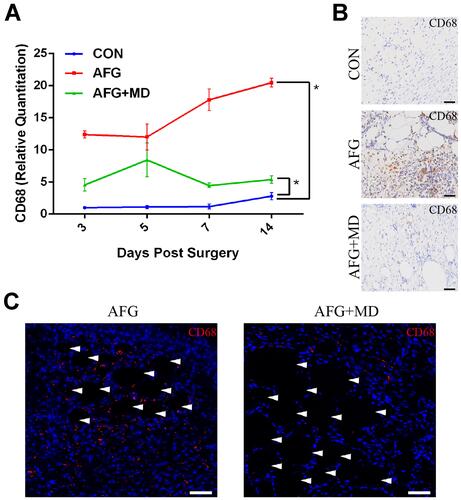
Figure 2 Gross wound appearance presentation and analysis. (A) Digital images of representative wounds images at day 0, 3, 5, 7, 10, 14. Scale bar = 0.5 cm. (B) ImageJ software used to reappear wounds healing process. Scale bar = 2 cm. (C) Quantification of the wound area. (D) The percentage of wound closure are presented by a fold line diagram. (E) Schematic representation of distinct stages during the skin repair response. *P<0.05.
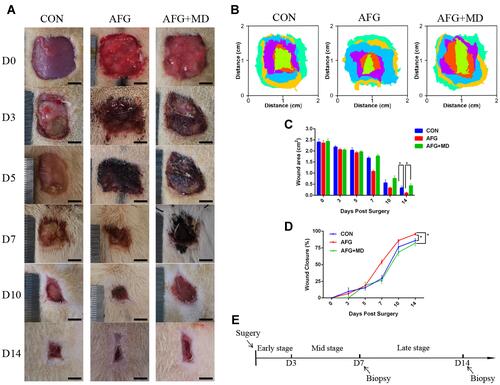
Figure 3 Histology and morphology studies of wounds. (A) H&E staining (40×magnification, scale bar = 200 μm) of wounds specimens at 7 and 14 days post surgery. Black dashed line outlines granulation tissue; black arrowhead shows the first hair follicle from wounds edge; black folded a black fold line shows the distance from the advancing tip of the epithelialization tongue to the site of the first hair follicle; red arrowhead shows incompletely formed skin appendages. (B) The thickness analysis of granulation tissue (g) of day 7 H&E stained wound sections by ImageJ. (C) The length analysis of reepithelialization of day 14 H&E stained wound sections by ImageJ. *P<0.05, **P<0.01.
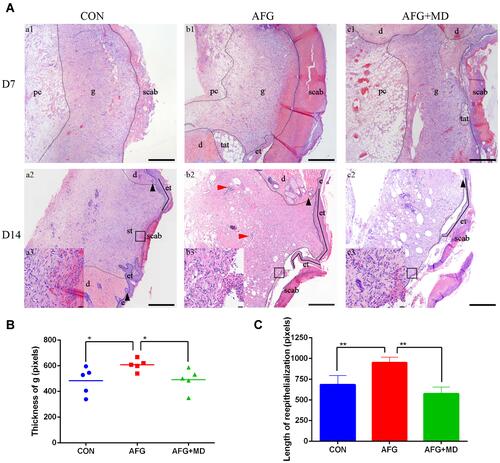
Figure 4 The relative quantitation for mRNA expression of inflammatory factors and wound healing related growth factors. (A) The mRNA expression of inflammatory factor IL-10, IL-6 and TNF-α. (B) The mRNA expression of growth factor PDGF-β, IGF-1, TGF-β. *P<0.05 (the AFG group versus the CON group or the AFG+MD group).
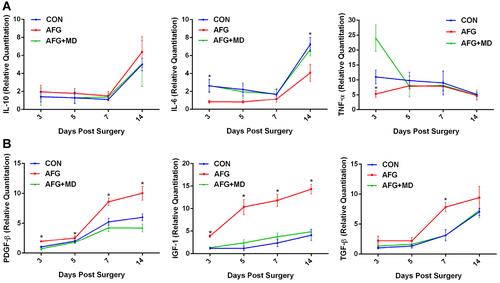
Figure 5 The analysis of ECM formation on day 14. (A) Anti-CD31 immunohistochemistry assays. Scale bar = 50 μm. (B) Quantification of blood vessel density by measuring the percentage of CD31-positive area. (C) Masson trichrome staining of day 14 wounds to evaluate the collagen formation. Scale bar = 50 μm. (D) Western blot assays of Col-Iα, α-SMA and GAPDH as an internal reference. (E) The relative quantitation of bFGF mRNA expression. (F) The relative quantitation of FGF-7 mRNA expression. *P<0.05.
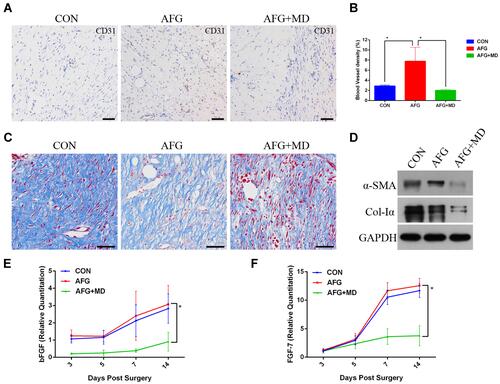
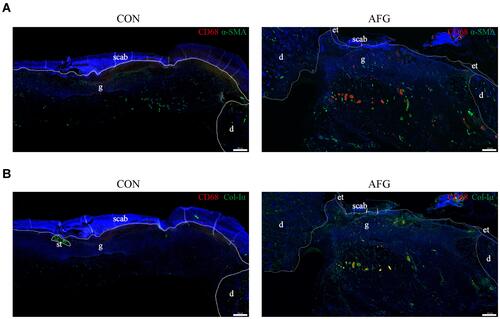
Figure 6 Immunofluorescent double-staining analysis. (A) Immunofluorescent double labeling for CD68 (red) and α-SMA (green). Scale bar = 200 μm. (B) Immunofluorescent double labeling for CD68 (red) and Col-Iα (green). The white dotted circle shows the scar tissue on the CON group. Scale bar = 200 μm.