Figures & data
Figure 1 Sirt6 is downregulated in CMECs in response to EndMT induced by HG+PA. (A) A mouse mode of T2DM was constructed, and 2 h post-IPGTT hyperglycemia was performed (n = 20). (B) Representative images of IF staining in different vessels. Red fluorescence represents CD31, green fluorescence represents α-SMA, and blue fluorescence represents the nucleus (n = 5). (C and D) Western blotting and quantitative analysis of CD31, α-SMA, and Sirt6 protein levels in CMECs treated with HG+PA. (E) Representative images of IF staining in CMECs from the NG and HG+PA groups. Red fluorescence represents CD31, green fluorescence represents α-SMA, and blue fluorescence represents the nucleus (n = 5). *P < 0.05 vs NG.
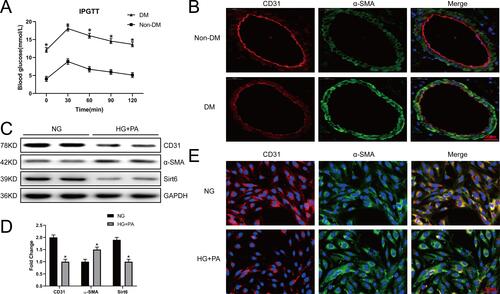
Figure 2 Endothelium-specific Sirt6 knockout worsens perivascular fibrosis and diabetic cardiomyopathy in T2DM. (A) Representative images of Masson trichrome staining in mouse hearts from different groups (n = 6). (B) Representative images of wheat germ agglutinin staining in different groups (n = 6). (C) Cardiac function evaluated using M-mode echocardiograms (n = 8). (D) Quantitative analysis of perivascular Masson trichrome staining (n = 6). (E) Quantitative analysis of wheat germ agglutinin staining in different groups (n = 6). (F–I) Calculated cardiac function indices: LVEDD, LVESD, LVEF, and LVFS (n = 8). *P < 0.05 vs WT+Non-DM; #P < 0.05 vs Sirt6 KOEC+Non-DM; ^P < 0.05 vs WT+DM.
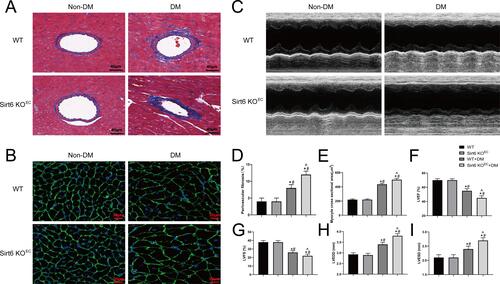
Figure 3 Sirt6 knockout contributes toward proliferation, migration, and mesenchymal features expressing in CMECs exposed to HG+PA. (A) Representative images from the EdU proliferation assay in CMECs treated as indicated. Red fluorescence represents proliferating cells (n = 5). (B) Representative images from the scratch-migration assay in CMECs (n = 5). (C) Western blotting and quantitative analysis of α-SMA, and CD31 protein levels in CMECs treated as indicated (n = 5). (D) Quantitative analysis of EdU proliferation assay results (n = 5). (E) Quantitative analysis of scratch-migration assay results (n = 5). (F) Quantitative analysis of α-SMA, and CD31 protein levels in CMECs treated as indicated (n = 5). *P < 0.05 vs NG+Ad-scramble; #P < 0.05 vs NG+Ad-shSirt6; ^P < 0.05 vs HG+PA+Ad-scramble.
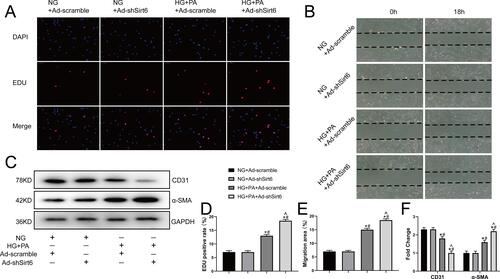
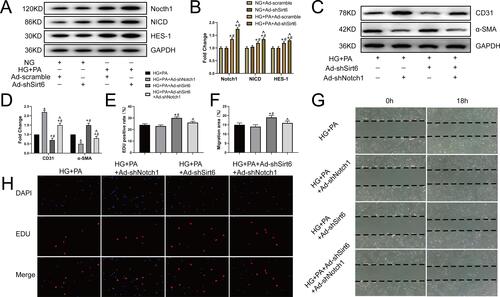
Figure 4 Sirt6 mediates EndMT via Notch1 signaling in CMECs. (A and B) Western blotting and quantitative analysis of Notch1, NICD, and HES-1 protein levels in CMECs treated as indicated (n = 5). (C and D) Western blotting and quantitative analysis of α-SMA and CD31 protein levels in CMECs treated as indicated (n = 5). (G and F) Scratch-migration assay and quantitative analysis in CMECs (n = 5). (H and E) EdU proliferation assay and quantitative analysis in CMECs (n = 5). *P < 0.05 vs HG+PA; #P < 0.05 vs HG+PA+ Ad-shNotch1; ^P < 0.05 vs HG+PA+Ad-shSirt6.