Figures & data
Table 1 AUCs of Different Metabolic Indices in Predicting of MS at Baseline
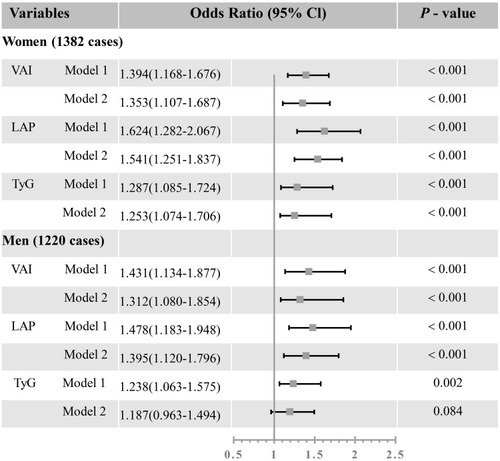
Figure 1 Associations between different metabolic indices and incident MS. ORs are presented per 1 SD increase in the marker. Model 1, adjusted for age; model 2, additionally adjusted for education, profession, family income, alcohol intake, smoking status, physical activity, dietary habits, medication history.
Abbreviations: MS, metabolic syndrome; Cl, confidence interval; VAI, visceral adiposity index; LAP, lipid accumulation product; TyG, product of triacylglycerol and glucose.