Figures & data
Table 1 Characteristics of Participants
Figure 1 Participant flow.
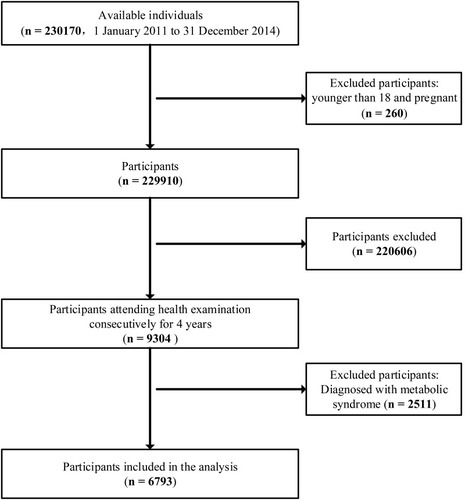
Figure 2 Predictors selection using the least absolute shrinkage and selection operator (LASSO) binary logistic regression model. (A) LASSO coefficient profiles of the 14 texture features. A coefficient profile plot was produced against the log (λ) sequence. (B) Hyperparameter (λ) selection in the LASSO model used 10-fold cross-validation via minimum criteria. Dotted vertical lines were drawn at the optimal values by using the minimum criteria and the 1 standard error of the minimum criteria (the 1-SE criteria).
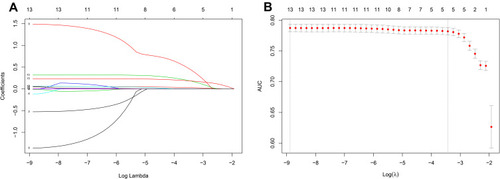
Figure 3 Calibration plot.
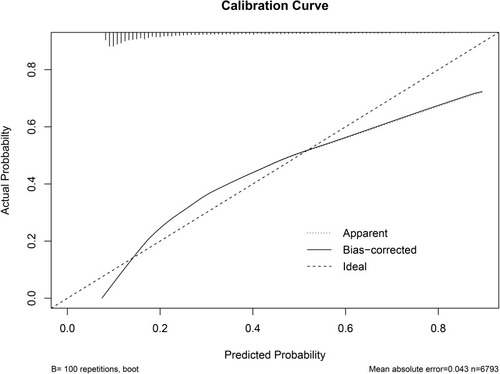
Figure 4 Decision-curve analysis.
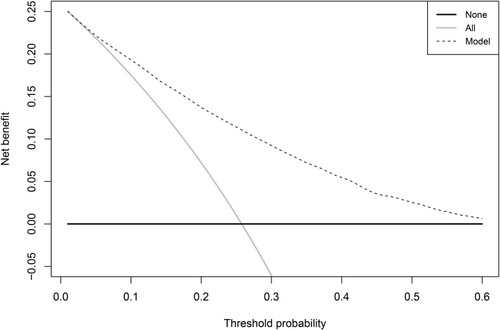
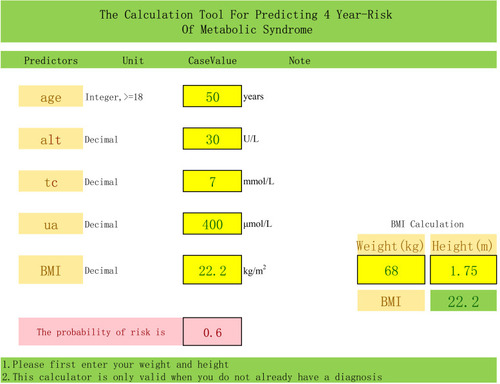
Figure 5 A clinical example of the application of the calculator 4-year risk of 60% based on the prognostic prediction model for a man, age 50, total cholesterol of 7 mmol/l, serum uric acid of 400 μmol/l, alanine transaminase of 30 U/L, body mass index (22.2 kg/m2).