Figures & data
Table 1 Baseline Characteristics of Patients with DN and Normal Controls
Figure 1 Histopathological examination of nondiabetic adjacent normal kidney tissues (NC) and renal biopsy sections from DN patients. Representative images showing (A) Masson’s trichrome staining, (B) PAS staining, (C) immunohistochemical staining for AdipoR1, and (D) immunohistochemical staining for p-ACC. All the images are magnified 200×. Quantitative analysis of the (E) percentage of the collagen fiber area, as shown by Masson’s trichrome staining, (F) Mean basement membrane thickness of renal tubules, as shown by PAS staining, (G) Cumulative optical density values for AdipoR1 and (H) p-ACC, as determined by immunohistochemistry. All the data are expressed as means ± SEMs (*p < 0.05 vs NC).
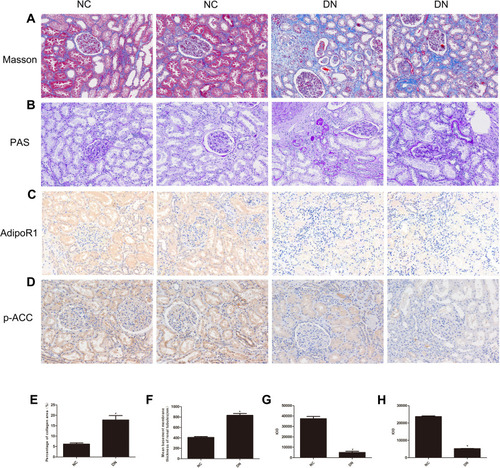
Table 2 Effect of Empagliflozin on Renal Functional Parameters and Lipid Metabolism Parameters in Mice in the Diabetic (DN), Diabetic Plus Empagliflozin (DN+Em) and Diabetic Plus Empagliflozin Plus Compound C (DN+Em+CC) Groups
Figure 2 Histopathological examination of renal tissue in mice in the negative control (NC), diabetic (DN), diabetic plus empagliflozin (DN+Em) and diabetic plus empagliflozin plus compound C (DN+Em+CC) groups. (A–E) Representative photomicrographs showing H&E, Masson’s trichrome, PAS, immunohistochemical staining for AdipoR1 (400×) and oil red O staining. All images are magnified 200×. (F–I) Quantification of the Masson’s trichrome, PAS, immunohistochemical staining for AdipoR1 and oil red O staining results. *p < 0.05 vs NC; &p < 0.05 vs DN; #p < 0.05 vs DN+Em.
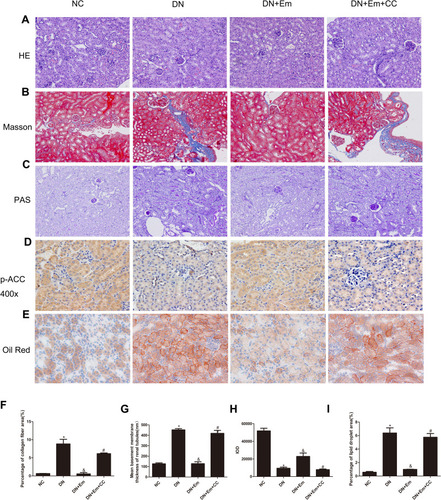
Figure 3 (A) Protein expression analysis of p-AMPK, AMPK, p-ACC and ACC in mice in the negative control (NC), diabetic (DN), diabetic plus empagliflozin intervention (DN+Em), and diabetic plus empagliflozin plus compound C (DN+Em+CC) groups. (B) Histogram of p-AMPK, AMPK, p-ACC and ACC expression. (C and D) Histogram of p-AMPK/AMPK and p-ACC/ACC ratios.*p < 0.05 vs NC; &p < 0.05 vs DM; #p < 0.05 vs DM+Em.
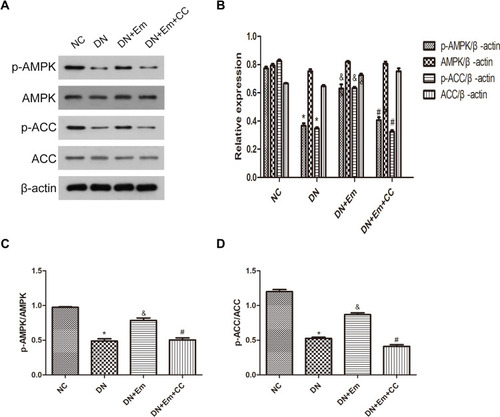
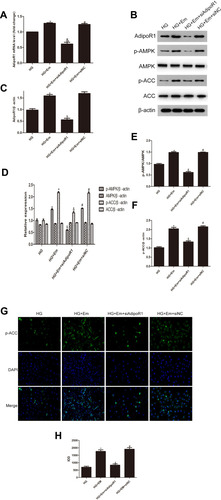
Figure 4 (A) Protein expression analysis of p-AMPK, AMPK, p-ACC and ACC in low-glucose HK-2 cells (NC), high-glucose HK-2 cells (HG), high-glucose plus empagliflozin-treated HK-2 cells (HG+Em), and high-glucose plus empagliflozin plus compound C HK-2 (HG+Em+CC) cells. (B) Histogram of p-AMPK, AMPK, p-ACC and ACC expression. (C and D) Histogram of the p-AMPK/AMPK and p-ACC/ACC ratios. (E) Representative images and of immunofluorescence staining for AdipoR1. All images are magnified 200x. (F) Cumulative optical density values for AdipoR1 *p<0.05 vs. NC; &p<0.05 vs. HG; #p<0.05 vs. HG+Em.
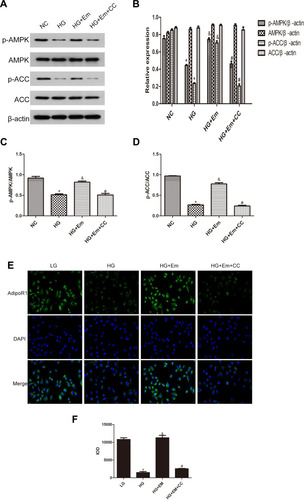
Figure 5 Levels of AdipoR1, p-AMPK, AMPK, p-ACC and ACC in HK-2 cells transfected with siAipoR1 or siNC and treated with empagliflozin under high-glucose conditions. (A) RNA level of AdipoR1. (B) Protein levels of AdipoR1, p-AMPK, AMPK, p-ACC and ACC. (C–F) Histogram of the protein levels of AdipoR1, p-AMPK, AMPK, p-ACC and ACC. (E) Representative images and of immunofluorescence staining for p-ACC. All images are magnified 200x. (F) Cumulative optical density values for p-ACC. *p < 0.05 vs HG; &p < 0.05 vs HG+Em; #p < 0.05 vs HG+Em+siAdipoR1. (G) Representative images and of immunofluorescence staining for p-ACC. All images are magnified 200x. (H) Cumulative optical density values for p-ACC *p < 0.05 vs HG; &p < 0.05 vs HG+Em; #p < 0.05 vs HG+Em+siAdipoR1.