Figures & data
Figure 1 DHM attenuates HG-induced oxidative stress in ARPE 19 cells. (A) Cell viability was examined using a CCK-8 kit when ARPE 19 cells were treated with different dose of DHM. (B) Cell viability was detected using a CCK-8 kit when ARPE 19 cells were stimulated with HG in the presence or absence of DHM. (C) The production of intracellular ROS was measured using DCFH-DA as a fluorescence probe. (D–F) The levels of oxidative stress-related markers including SOD, CAT and GSH were evaluated using the commercially available kits. ***P<0.001 vs MA; #P<0.05, ##P<0.01, ###P<0.001 vs HG.
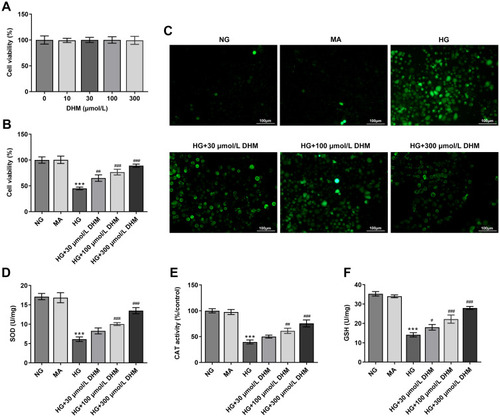
Figure 2 DHM suppresses apoptosis in HG-stimulated ARPE 19 cells. (A) Apoptosis of HG-induced ARPE 19 cells in the presence or absence of DHM was measured using TUNEL staining. (B) The quantification of apoptotic cells. ***P<0.001 vs MA; ###P<0.001 vs HG.
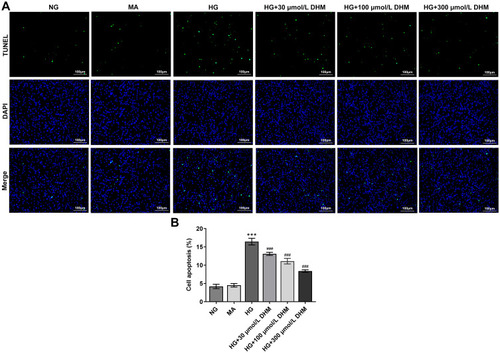
Figure 3 DHM affects the expression of apoptosis-related proteins in ARPE 19 cells exposed to HG. The expression of Bcl-2, Bax, cleaved caspase-3 and cleaved caspase-9 was evaluated using Western blot analysis. ***P<0.001 vs MA; #P<0.05, ##P<0.01, ###P<0.001 vs HG.
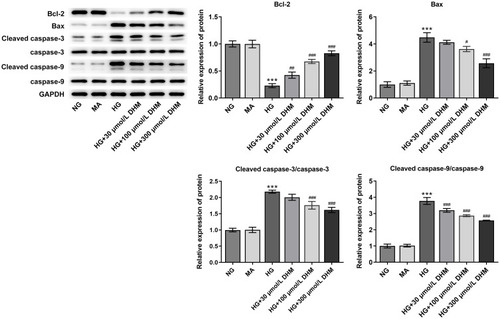
Figure 4 MiR-34a expression alleviates the inhibitory effects of DHM on oxidative stress in ARPE 19 cells exposed to HG. (A) The expression of miR-34a was determined using RT-qPCR in HG-stimulated ARPE 19 cells in the presence or absence of DHM. ***P<0.001 vs MA; ##P<0.01 vs HG. (B) MiR-34a expression was detected by RT-qPCR after transfection with miR-34a mimic. ***P<0.001 vs mimic-NC. (C) Representative microscopic picture of cells emitting fluorescence of DCFH-DA. (D–F) The activities of SOD and CAT as well as the content of GSH were evaluated using the commercially available kits. ***P<0.001 vs HG; #P<0.05, ##P<0.01, ###P<0.001 vs HG+DHM+mimic-NC.
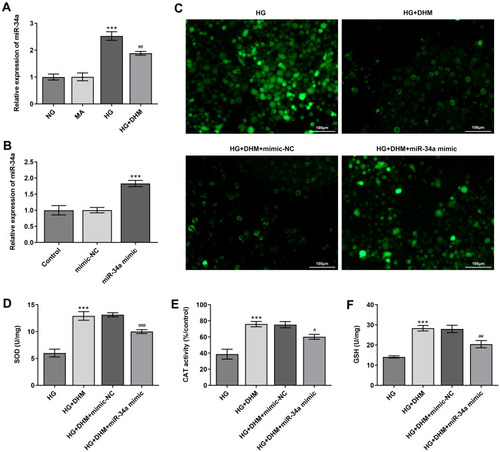
Figure 5 MiR-34a overexpression blocks the impact of DHM on apoptosis in HG-induced ARPE 19 cells. (A) Representative images of cell apoptosis. (B) The quantification of apoptotic cells. ***P<0.001 vs HG; ##P<0.01 vs HG+DHM+mimic-NC.
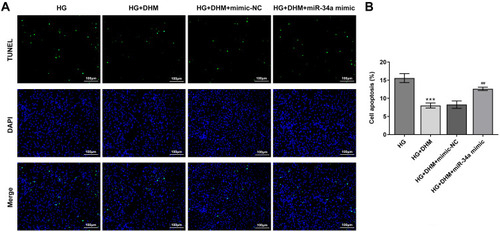
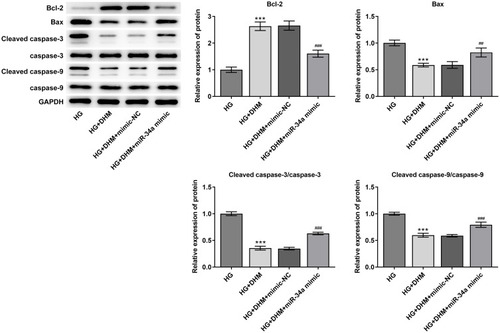
Figure 6 MiR-34a-upregulation recovers the effects of DHM on the expression of apoptosis-related proteins in ARPE 19 cells exposed to HG. The expression of Bcl-2, Bax, cleaved caspase-3 and cleaved caspase-9 was evaluated using Western blot analysis. ***P<0.001 vs HG; ##P<0.01, ###P<0.001 vs HG+DHM+mimic-NC.