Figures & data
Table 1 Clinical Characteristics of Participants Categorized by Sex and Metabolic Syndrome
Figure 1 Sex differences of Adipo-IR (A and B), FINS (C and D), and FFA (E and F) in all subjects and subgroups. Adipo-IR, adipose tissue insulin resistance; FINS, fasting insulin; FFA, free fatty acids; Con, control group; NMS, nonmetabolic syndrome; MS, metabolic syndrome. a P < 0.05 compared with the control group. b P < 0.05 compared with the NMS group.
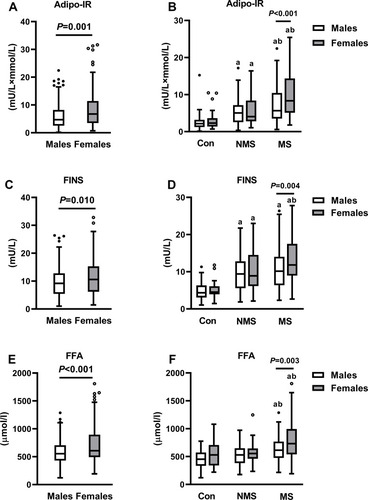
Table 2 Correlation Between Adipo-IR and Clinical Parameters in All Subjects, Male and Female Subjects
Figure 2 Multiple linear regression analysis of variables independently related to Adipo-IR in all subjects.
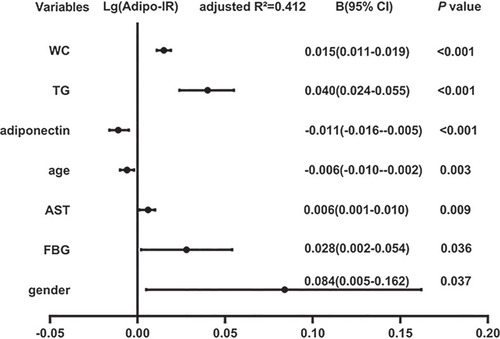
Figure 3 Number of subjects with different metabolic diseases in the tertiles of Adipo-IR. a P < 0.05 compared with the lowest tertile. b P < 0.05 compared with the median tertile.
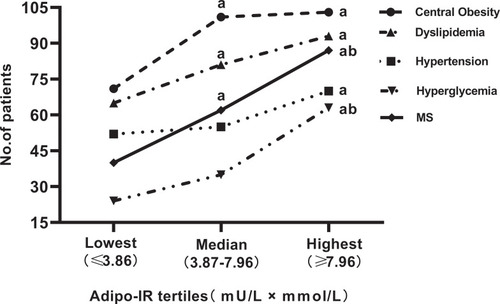
Table 3 Logistic Regression Analysis of the Risk of MS in the Tertiles of Adipo-IR
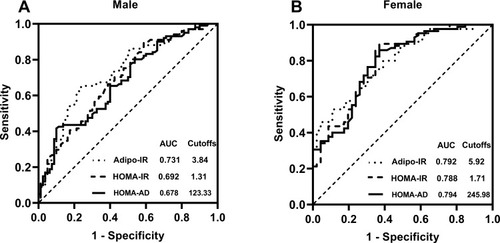
Figure 4 ROC curves of Adipo-IR, HOMA-IR, and HOMA-AD to distinguish between metabolic syndrome in male (A) and female (B) subjects in the study population.