Figures & data
Figure 1 (A) fasting blood glucose levels and (B) body weights of female diet-induced obese (DIO) C57BL/6 J mice during the 21-day dipterinyl calcium pentahydrate (DCP) dosing period. The mice were divided into four treatment groups of DCP 0, 7, 21, or 63 mg/kg/day.
Abbreviation: SEM, standard error of the mean.
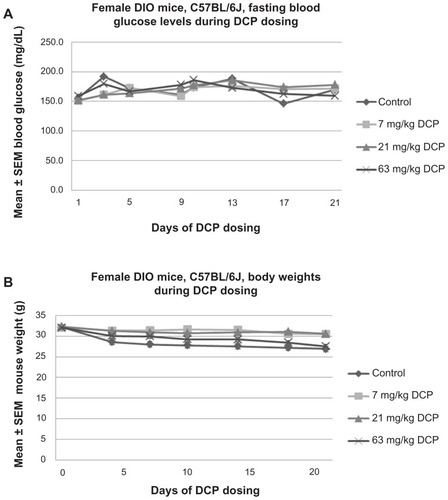
Table 1 One-way analyses of variance of oral glucose (glu) tolerance test area under the curve (OGTT/AUC); plasma indoleamine 2,3-dioxygenase metabolites tryptophan (Trp), kynurenine (Kyn), and calculated Kyn/Trp ratio; and certain cytokines/chemokines
Table 2 Multivariate linear regression of oral glucose tolerance test area under the curve (OGTT/AUC) CoefficientsTable Footnotea