Figures & data
Table 1 Clinical Characteristics of the MIS and the Control Group
Figure 1 Comparison of the general biochemical characteristics of the MIS group and the control group: (A) FBG, (B) HbA1C, (C) CHOL, (D) TG, (E) HDL-C and (F) LDL-C in MIS group and the control group; data are expressed as mean (±SD); P<0.05 is considered statistically significant; *, ** and *** indicate P-value less than 0.05, 0.01 and 0.001, respectively.
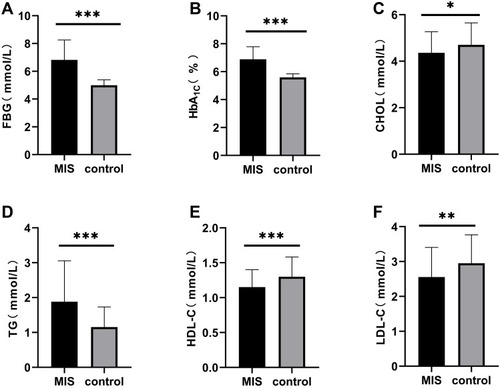
Figure 2 Comparison of the specific biochemical characteristics of the MIS group and the control group: (A) HPA, (B) CRP and (C) IL-6 in MIS group and the control group; data are expressed as mean (±SD); HPA, heparanase; CRP, C-reactive protein; IL-6, Interleukin-6; P<0.05 is considered statistically significant; * indicate P-value less than 0.05.
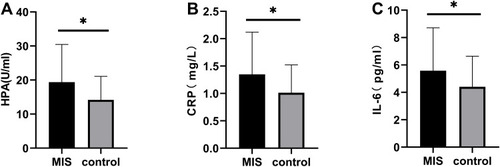
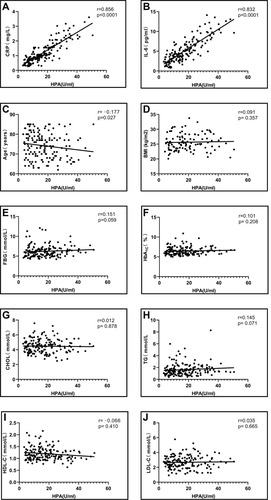
Figure 3 Correlations between serum HPA and CRP, IL-6 and clinical indicators in all subjects: Relationships between serum HPA and (A) CRP, (B) IL-6, (C) age, (D) BMI, (E) FBG, (F) HbA1C, (G) CHOL, (H) TG, (I) HDL-C, (J) LDL-C. P<0.05 is considered statistically significant.