
Figures & data
Figure 1 Flowchart of the included 4869 subjects from 9254 subjects in the NHANES 2017–2018 dataset.
Abbreviation: NHANES, National Health and Nutrition Examination Surveys.
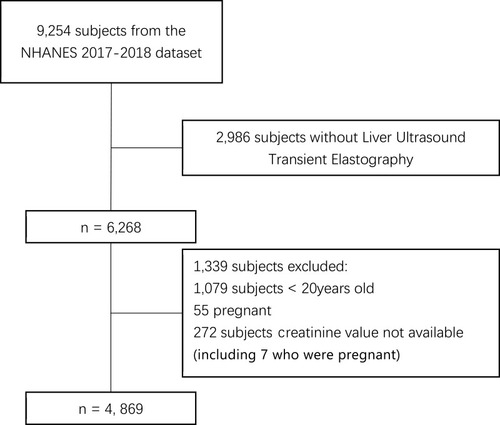
Table 1 Baseline Characteristics Before and After Propensity Score (PS) Matching
Table 2 Univariate and Logistic Regression Analysis in Patients Based on the PSM
Figure 2 Fibrosis classification based on FIB-4 or NFS scores in CKD and non-CKD subjects.
Abbreviations: CKD, chronic kidney disease; FIB-4, fibrosis-4; NFS, NAFLD fibrosis score.
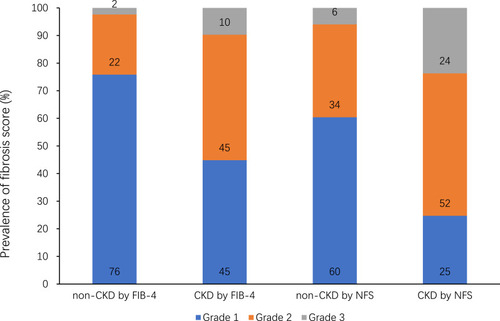
Table 3 Associations Between CKD in Subjects with MAFLD Complicated with DM
Table 4 Associations Between CKD in DM Subjects Not Complicated with MAFLD
Table 5 Associations Between CKD in Subjects with MAFLD Not Complicated with DM