Figures & data
Table 1 Baseline Characteristics of the Study Population Stratified by Gender
Table 2 Components of Metabolic Syndrome, NAFLD and Lifestyle Habits in the Subject Groups
Figure 1 Correlations of different adiposity indices and MetS components stratified by gender.
Abbreviations: WC, waist circumference; TG, triglyceride; TC, total cholesterol; HDL-c, high- density lipoprotein cholesterol; LDL-c, low-density lipoprotein cholesterol; FBG, fasting blood-glucose; HOMA-IR, homeostasis model assessment of insulin resistance; HbA1C, glycosylated haemoglobin; SBP, systolic blood pressure; DBP, diastolic blood pressure; BMI, body mass index; WHtR, waist-to-height ratio; CI, conicity index; BRI, body roundness index; ABSI, a body shape index; TMI, triponderal mass index; TyG, triglyceride glucose index; CUN-BAE, Clίnica Universidad de Navarra—body adiposity estimator.
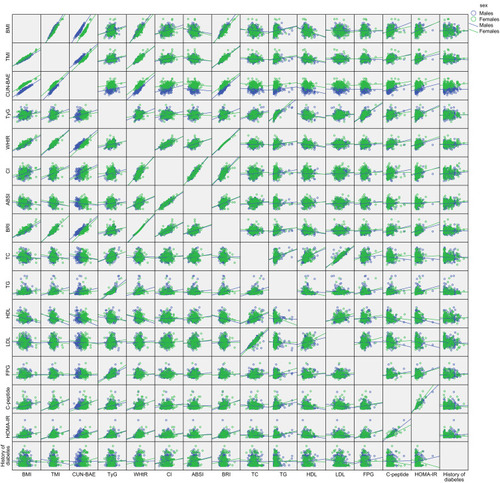
Table 3 A: Quartiles of Different Anthropometric Indices. B: Odds Ratios and 95% Confidence Intervals for MetS After Adjustment for Age, Sex and History of Smoking and Drinking
Table 4 AUC (95% CI) of Different Obesity Indices in Diagnosis of MetS Stratified by Age and Gender
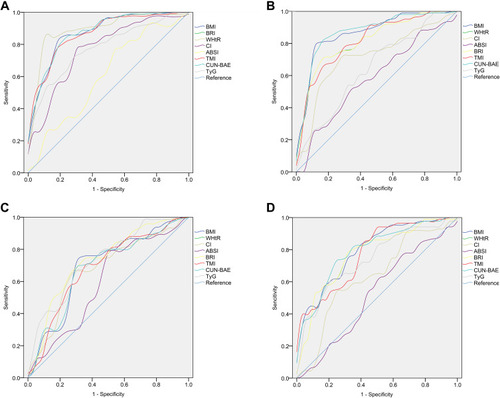
Figure 2 ROC curves for different obesity indices used to identify the presence of MetS in type 2 diabetes stratified by gender and age.
Notes: (A) Males aged 40–69; (B) males aged 60 and over; (C) females aged 40–69; (D) females aged 60 and over.
Abbreviations: BMI, body mass index; WHtR, waist-to-height ratio; CI, conicity index; BRI, body roundness index; ABSI, a body shape index; TMI, triponderal mass index; TyG, triglyceride glucose index; CUN-BAE, Clίnica Universidad de Navarra—body adiposity estimator.
Abbreviations: BMI, body mass index; WHtR, waist-to-height ratio; CI, conicity index; BRI, body roundness index; ABSI, a body shape index; TMI, triponderal mass index; TyG, triglyceride glucose index; CUN-BAE, Clίnica Universidad de Navarra—body adiposity estimator.