
Figures & data
Figure 1 The figure represents study rationale. The figure also depicts how biochemical parameters (cortisol and adiponectin) are associated with stress including both stress resilient and susceptible populations. (↑↑ – mild increment; ↑↑↑ – moderate increment; ↑↑↑↑ – high increment; ↓↓ – mild reduction; ↓↓↓ – moderate reduction; ↓↓↓↓ – high reduction; ↔ – no change).
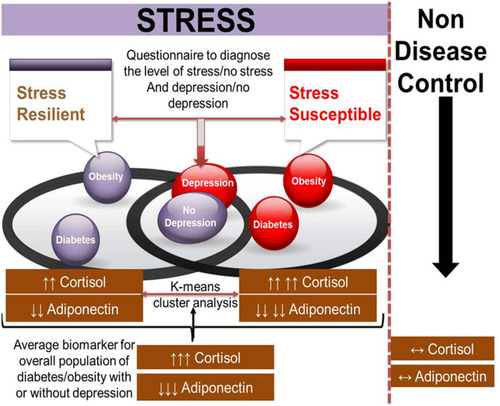
Figure 2 The figure demonstrates investigation plan of the study.
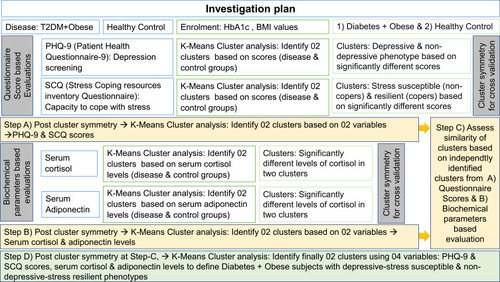
Table 1 Demographic Characteristics
Table 2 Independent Cluster Analysis Based on Scores from PHQ-9 and SCQ Questionnaires
Table 3 K-means Cluster Analysis: Identify Two Clusters Based on Scores from PHQ-9 and SCQ Questionnaires
Figure 3 The figure demonstrates cluster similarity across study population of diabetes. (C1: diabetic/obese patients without depression; C2: diabetic/obese patients with depression). (A) Similarity of clusters based on questionnaire scores: two clusters were identified by independently using SCQ and PHQ-9 questionnaire score as variables employing K-means cluster analysis. The independent clusters (C1 and C2) identified by SCQ scores and (C1 and C2) of PHQ-9 scores were matched subject to subject for accuracy estimations. (B) Similarity of clusters based on biochemical evaluations: two clusters were identified by independently using adiponectin and cortisol levels as variables employing K-means cluster analysis. The independent clusters (C1 and C2) identified by adiponectin levels and (C1 and C2) of cortisol levels were matched subject to subject for accuracy estimations. (C) Similarity of clusters based on questionnaire scores vs biochemical evaluations: two clusters were identified by independently using (1) SCQ and PHQ-9 questionnaire score as two variables together and (2) adiponectin and cortisol levels as two variables together. The independent clusters (C1 and C2) identified by questionnaire scores and of (C1 and C2) of biochemical evaluations were matched subject to subject for accuracy estimations.
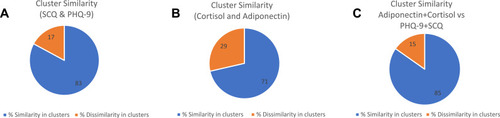
Table 4 Independent Cluster Analysis Based on Cortisol and Adiponectin Levels
Table 5 K-means Cluster Analysis: Identify Two Clusters Based on Cortisol and Adiponectin Levels
Table 6 Variations of Different Variables
Figure 4 Percent change from control of total diabetes populations and two identified clusters among diabetes population (C1: diabetic/obese patients without depression; C2: diabetic/obese patients with depression).
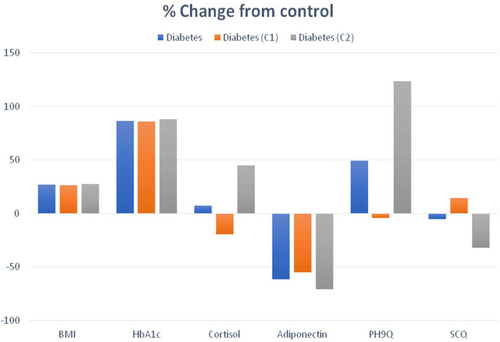
Table 7 ANOVA Variance Analysis Results for Different Variables