Figures & data
Figure 1 The effect of PSB on HG-enhanced HRVECs proliferation. (A) The cell viability of HRVECs that exposed to 0, 10, 20, 40 and 80 μg/mL PSB was determined using a CCK-8 kit. (B and C) Cell apoptosis was evaluated with TUNEL staining. **P<0.01 and ***P<0.001 vs 0 μg/mL PSB. (D) The cell viability of HRVECs that cultured in NG, MA, HG or HG plus PSB (10, 20, 40 μg/mL) was examined by a CCK-8 kit. (E) The protein expression of PCNA and Ki67 in HRVECs that cultured in NG, MA, HG, and HG plus PSB (40 μg/mL) was assessed by Western blot analysis. (F) Representative images of immunofluorescence staining for Ki67 (green), blue represents the nuclei which were stained with DAPI (x200). **P<0.01 and ***P<0.001 vs NG; ###P<0.001 vs HG.
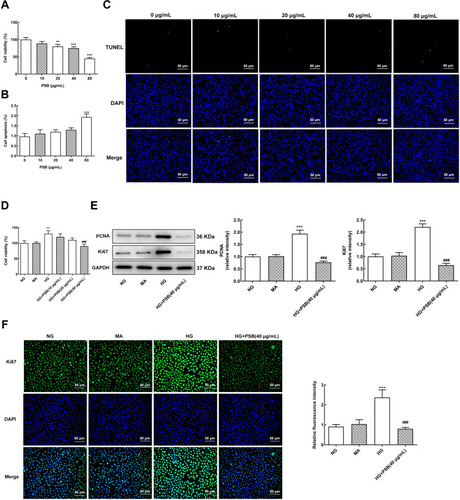
Figure 2 The effect of PSB on HG-stimulated HRVECs migration and angiogenesis. (A) Representative images for wound healing assay. The migration distance was calculated as the width of the scratch at 24 h minus the width of the scratch at 0 h. The relative migration distance was calculated by normalizing to NG group. (B) Representative images for transwell assay. (C) Representative images for tube formation assay. ***P<0.001 vs NG, ###P<0.001 vs HG.
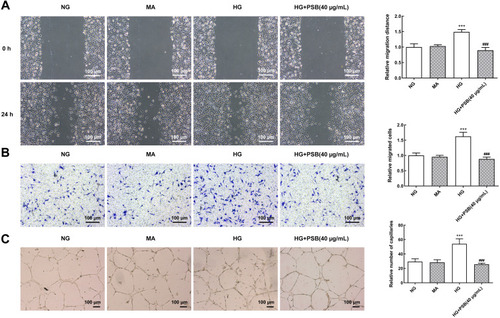
Figure 3 The effect of MEK/ERK signaling on PSB-inhibited HRVECs proliferation. (A and B) The expression of VEGF mRNA and VEGF-R2 mRNA in HRVECs that cultured in NG, MA, HG and HG plus PSB (40 μg/mL) was assessed by RT-qPCR. (C) The protein expression of p/t-Raf, p/t-MEK1/2 and p/t-ERK in HRVECs that cultured in NG, MA, HG and HG plus PSB (40 μg/mL) was tested by means of Western blot analysis. (D) The protein expression of p/t-ERK1/2 in HRVECs that cultured in NG, MA, HG, HG plus PSB (40 μg/mL) and HG plus PSB (40 μg/mL) plus p-ERK inhibitor SLIGKV was measured using Western blotting. (E) The cell viability of HRVECs that cultured in NG, MA, HG, HG plus PSB (40 μg/mL) and HG plus PSB (40 μg/mL) plus p-ERK inhibitor SLIGKV was examined by a CCK-8 kit. (F) The protein expression of PCNA and Ki67 in HRVECs that cultured in NG, MA, HG, HG plus PSB (40 μg/mL) and HG plus PSB (40 μg/mL) plus p-ERK inhibitor SLIGKV was detected with Western blot analysis. ***P<0.001 vs NG; ###P<0.001 vs HG; ΔΔP<0.01 and ΔΔΔP<0.001 vs HG + PSB (40 μg/mL).
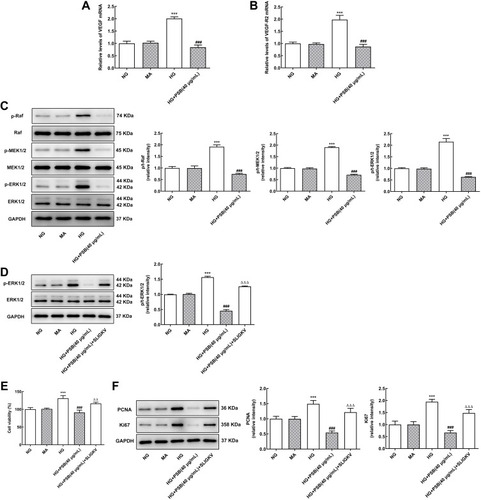
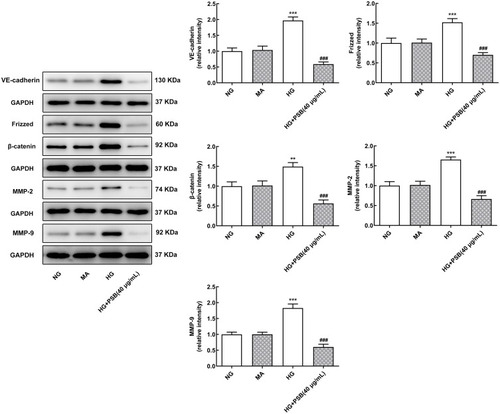
Figure 4 The effect of PSB on the expression of proteins involved in VEGF/VE-cadherin axis. The protein expression of VE-cadherin, Frizzed, β-catenin, MMP2 and MMP9 in HRVECs that cultured in NG, MA, HG, HG plus PSB (40 μg/mL) was detected by Western blot assay. **P<0.01 and ***P<0.001 vs NG; ###P<0.001 vs HG.