Figures & data
Figure 1 The outline of animal study. Male ICR mice were arrived at 10 weeks of age were fed standard diet to acclimate for 6 weeks. After that, mice were divided into two group of LFD and HFD group, moreover, the HFD group was divided into two groups with or without SKL-14959. That day was defined at day 1 and the terms of administration were 151 day. A mouse in the LFD group was excluded because of death by ITT, resulting was in the 8 mice. A mouse in the SKL-14959 treatment group was excluded because of a severe abrasion injury on the neck by the lid of food dispenser, resulting was in the 8 mice.
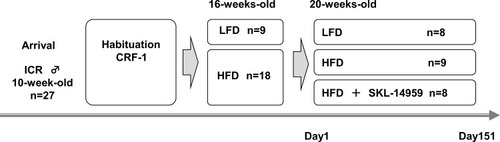
Table 1 Effects of SKL-14959 Treatment
Figure 2 Effects of fasting blood glucose (A), change in blood glucose (B) and the AUC (C) in OGTT, HbA1c (D), blood glucose (E) and the AUC (F) in ITT, total, liver (G), soleus (H), adductor (I), gastrocnemius (J), vastus lateralis (K) and sum of muscle (L) TG contents on SKL-14959 treatment in the DIO mice. Data are expressed as means ± standard error in each group; LFD n=8, HFD n=9, HFD+SKL-14959 n=8. #p<0.05, ##p<0.01, ###p<0.001, vs LFD (t-test), *p<0.05 vs HFD control (t-test).
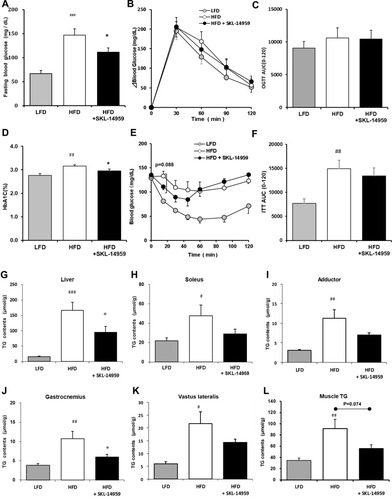
Figure 3 Effects of total lipase activity (A), LPL activity (B), and HL activity (C) on SKL-14959 treatment in the DIO mice. Data are expressed as means ± standard error in each group; LFD n=8, HFD n=9, HFD+SKL-14959 n=8. *p<0.05 vs HFD control (t-test).
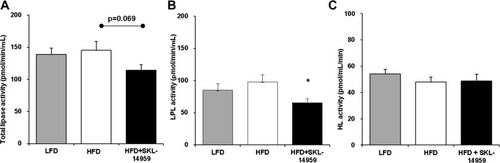
Figure 4 The relationship between weight gain versus body weight (A), liver weight (B), WATs(C), BMI (D), liver TG (E) and the sum of each muscle TG (F) of diabetic control group in DIO mice.
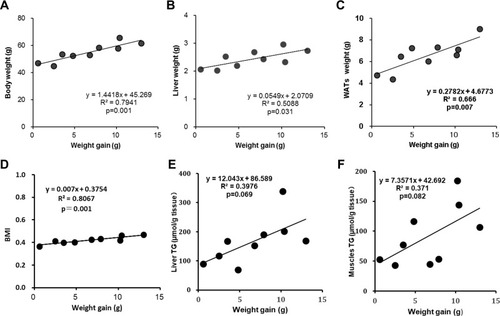
Figure 5 The relationship between weight gain versus total lipase activity (A), total lipase activity versus WATs (B), red muscle; soleus and adductor (C), white muscle; gastrocnemius and vastus lateralis (D) and liver TG (E), HbA1c versus liver TG (F), and GIP versus LPL activity (G) and insulin (H) on the SKL-14959 group in DIO mice. Note; Plasma insulin in the treatment group was excluded one data because of technical trouble in the assay, resulting was n=7.
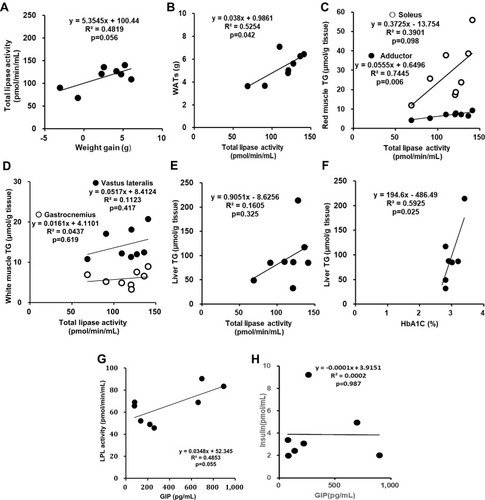
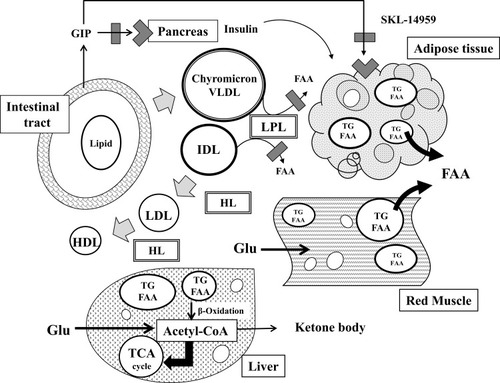
Figure 6 The mechanism of SKL-14959 in lipids and glucose metabolism. Diets secret GIP and insulin as well as increase postprandially chylomicron remnants in blood, and then chylomicron particles are sequentially hydrolyzed by LPL and HL, being metabolized to VLDL, IDL, LDL, and HDL. The inhibition of LPL activity can decrease the production of FFAs from lipid particles, catabolizing excess ectopic fat in adipocyte and muscle. After that, glucose uptake is enhanced, and increase glucose utility with beta-oxidation in muscle and liver.