
Figures & data
Table 1 Baseline Characteristics of the Study Participants (N = 1113)
Table 2 Results of Mixed Linear Regression Models on the Association of Serum HOMA-IR and hsCRP Levels with Metabolic Status in All Twins
Table 3 Results of Mixed Linear Regression Models on the Association of Serum HOMA-IR and CRP Levels with Metabolic/Obesity Phenotypes in All Twins
Figure 1 (A) Association between obesity status, number of MetS components and level of HOMA-IR. (B) Association between obesity status, number of MetS components and level of hsCRP. The bolded number means the correlation was significant at p<0.05. The adjusted covariates included sex, zygosity, place, age, lifestyle factors (smoking, drinking, and physical activity), TC and HA1bC.
Abbreviations: MetS, metabolic syndrome; HOMA-IR, homeostasis model assessment of insulin resistance; hsCRP, high-sensitivity CRP.
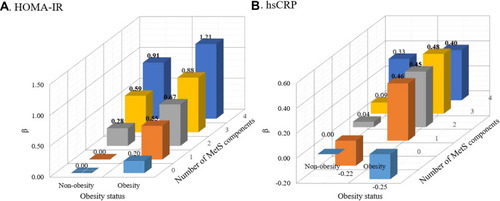
Table 4 Results of Fixed Linear Regression Models on the Association of Serum HOMA-IR and hsCRP Levels with Metabolic Status in Twin Pairs
Table 5 Results of Fixed Linear Regression Models on the Association of Serum HOMA-IR and hsCRP Levels with Metabolic/Obesity Phenotypes in Twin Pairs