Figures & data
Figure 1 Experimental procedure.
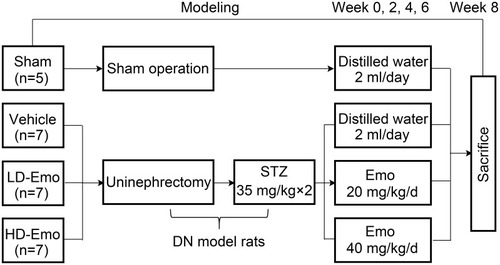
Figure 2 Effects of Emo on changes in body weight, kidney weight/body weight and renal appearance.
Abbreviations: Emo, emodin; BW, body weight; KW/BW, kidney weight/body weight; LD-Emo, low-dose emodin; HD-Emo, high-dose emodin.
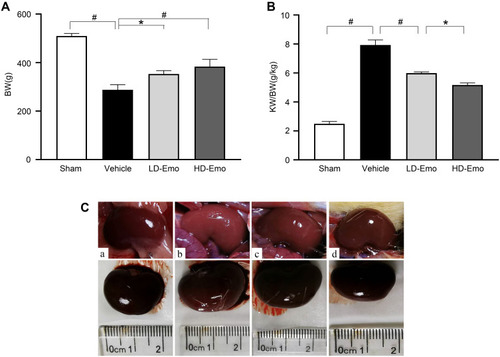
Figure 3 Effects of Emo on changes in urinary albumin/urinary creatinine ratio and blood glucose. Data are expressed as mean ± SEM. # P < 0.01.
Abbreviations: Emo, emodin; Urinary ACR, urinary albumin/urinary creatinine ratio; BG, blood glucose; LD-Emo, low-dose emodin; HD-Emo, high-dose emodin.
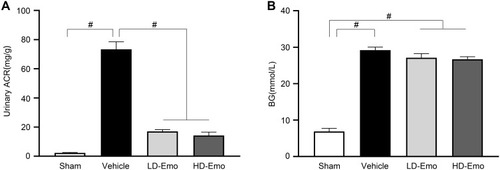
Table 1 Comparison of Blood Biochemical Parameters of Rats Among Groups at the end of 8 Weeks
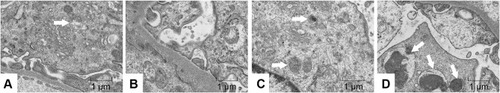
Figure 4 Effects of Emo on the glomerular morphological changes.
Abbreviations: Emo, emodin; ECM, extracellular matrix; LD-Emo, low-dose emodin; HD-Emo, high-dose emodin.
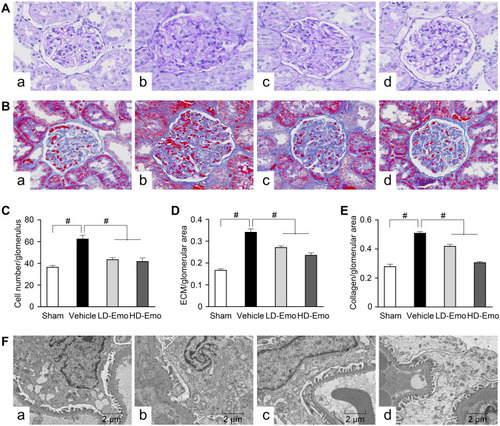
Figure 5 Effects of Emo on the glomerular and tubular epithelial cell apoptosis.
Abbreviations: Emo, emodin; TUNEL, terminal deoxynucleotidyl transferase (TdT)-mediated deoxyuridine triphosphate (dUTP)-biotin nick end labeling; LD-Emo, low-dose emodin; HD-Emo, high-dose emodin.
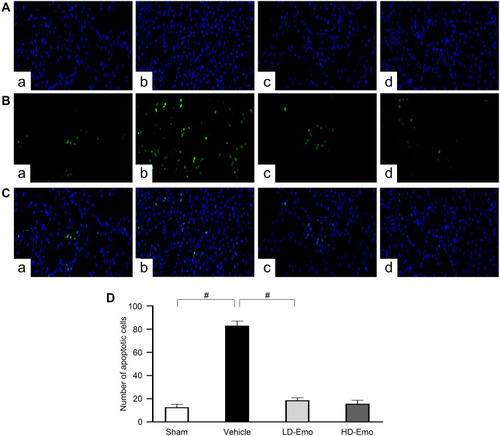
Figure 6 Effects of Emo on the protein expression of Bax and Cleaved caspase-3 in the kidney.
Abbreviations: Emo, Emodin; LD-Emo, low-dose Emodin; HD-Emo, high-dose Emodin.
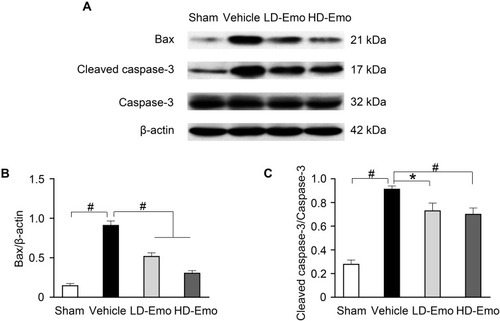
Figure 7 Effects of Emo on the protein expression of nephrin, LC3-II/I, Beclin-1, p62, p-AMPK, AMPK, p-mTOR and mTOR in the kidney.
Abbreviations: Emo, Emodin; LD-Emo, low-dose Emodin; HD-Emo, high-dose Emodin; LC3, microtubule-associated protein 1 light-chain 3; P62 protein, p62/sequestosome-1 protein; AMPK, adenosine 5ʹ-monophosphate (AMP)-activated protein kinase; p-AMPK, phospho-AMPK; mTOR, mammalian target of rapamycin; p-mTOR, phospho-mTOR.
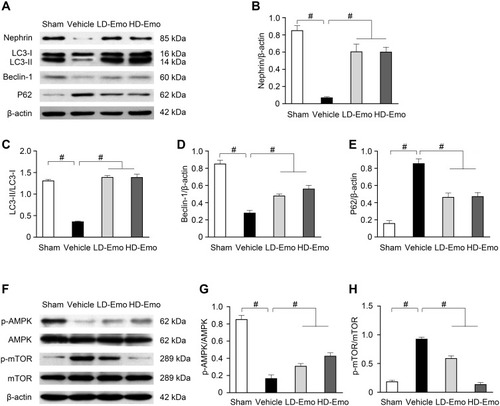
Figure 8 Effects of Emo on the autophagy of podocytes in rats with DN.
Abbreviations: Emo, emodin; LD-Emo, low-dose emodin; HD-Emo, high-dose emodin.