Figures & data
Table 1 Primer Sequences for All Primers Used in RT-qPCR
Table 2 Demographic Data of the Study Subjects
Figure 1 mRNA expression of Bcl-2 in PBMC of lean, obese, T2DM, and T2DM on metformin. Results are presented as mean ± S.E.M.
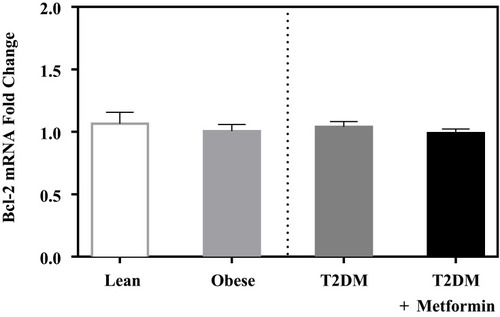
Figure 2 mRNA expression of three members of the Bcl-2 family that promote apoptosis in PBMC of lean, obese, T2DM, and T2DM on metformin: (A) Bak; (B) Bax; and (C) Bcl-10. Results are presented as mean ± S.E.M. *P < 0.05 vs lean subjects; σP < 0.05 vs obese subjects; δP < 0.05 vs T2DM subjects.
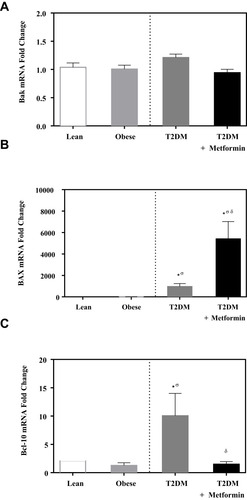
Figure 3 mRNA expression of three members of apoptotic BH3 domain-only proteins that bind and regulate the anti-apoptotic Bcl-2 proteins in PBMC of lean, obese, T2DM, and T2DM on metformin: (A) Bad; (B) Bid; and (C) Bim. Results are presented as mean ± S.E.M. *P < 0.05 vs lean subjects; σP < 0.05 vs obese subjects; δP < 0.05 vs T2DM subjects.
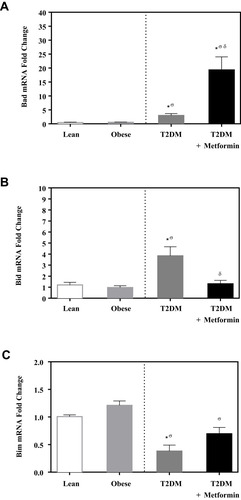
Figure 4 mRNA expression of three caspases in PBMC of lean, obese, T2DM and T2DM on metformin: (A) CASP3; (B) CASP7; (C) CASP8; and (D) CASP9. Results are presented as mean ± S.E.M. *P < 0.05 vs lean subjects; σP < 0.05 vs obese subjects; δP < 0.05 vs T2DM subjects.
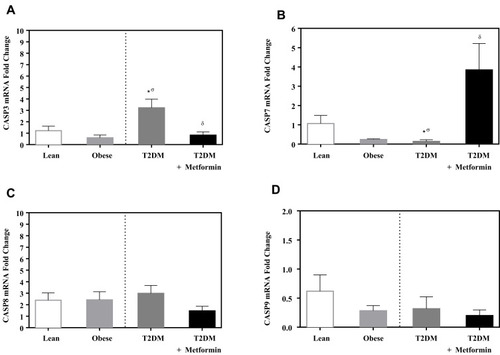
Figure 5 Apoptotic protease activating factor 1 (Apaf1) mRNA expression in PBMC of lean, obese, T2DM, and T2DM on metformin. Results are presented as mean ± S.E.M.
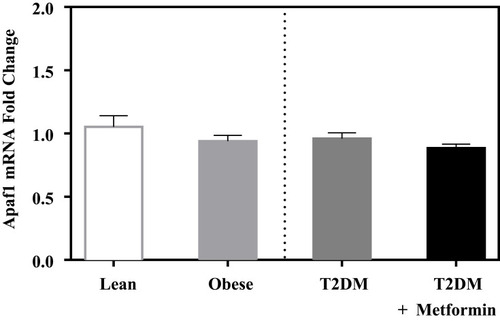
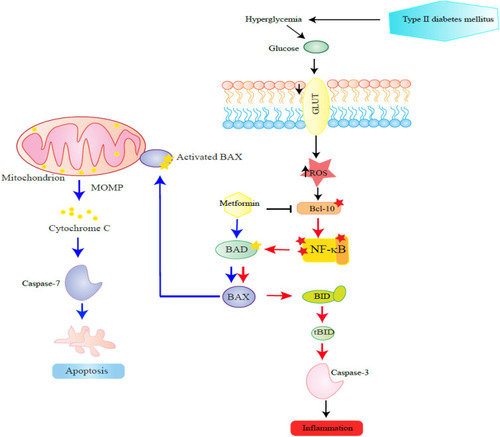
Figure 6 This figure schematizes steps in the proposed effect of metformin on apoptotic proteins in PBMCs examined in this study. The steps are depicted in a sequence proceeding from right to left. Hyperglycaemia presents in diabetes induces NF-κB pathway by reactive oxygen species (ROS). The low to moderate up-regulation of inflammatory Bcl-10, Bax, Bad, Bid, and the effector caspase-3 coupled with inhibition of caspase-7 in circulating PBMCs of T2DM could be a result of activated NF-κB pathway in T2DM.