
Figures & data
Figure 1 Study recruitment diagram. Patient selection for evaluating associations between lifestyle habits and adverse health outcomes in propensity score (PS)-matched subjects who gained ≥10 kg versus <10 kg after age 20 years is summarized in the study flowchart. The PS-matched analysis was conducted employing the following covariates: age, sex, and BMI at the time of the study. We used 0.1 times the pooled standard deviation of the logit of the PS as the caliper width for the PS matching.
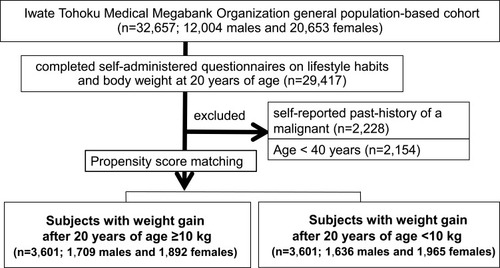
Table 1 Characteristics of the Study Participants
Table 2 The Comparison of the Number of Metabolic Syndrome Risk Factors by Weight Gain After 20 Years of Age
Table 3 Odds Ratios of Metabolic Disorder Prevalences from Multivariable Logistic Regression Model Associated with Weight Gain ≥10kg After 20 Years of Age vs Weight Gain <10kg
Table 4 The Comparison of Lifestyle Factors by Weight Gain After 20 Years of Age
Table 5 Odds Ratios of Lifestyle Factors from Multivariable Logistic Regression Model Associated with Weight Gain ≥10kg After 20 Years of Age vs Weight Gain <10kg