Figures & data
Table 1 Comparison of Clinical and Biochemical Data of Subjects
Table 2 Sequences of Scrambled shRNA and Salusin-β-shRNA
Figure 1 Serum levels of salusin-β in DM patients. (A) Serum salusin-β levels were measured in HCs and T2DM patients. All p-values were determined by unpaired Student’s t-tests. (B) Serum salusin-β levels in subgroups of DM patients. One-way ANOVA with Tukey’s test was used to calculate the p-values of comparisons between each pair of groups. All data were normally distributed. **p<0.01.
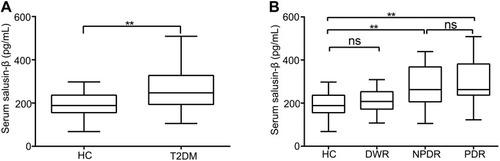
Figure 2 Expression levels of salusin-β at different time points and protein levels of pro-inflammatory cytokines after treatment with increasing concentrations of exogenous salusin-β. (A) After treatment with HG for 24 h, 48 h, and 72 h, the expression of salusin-β was measured by immunofluorescence. (B) Quantitative analysis of the salusin-β level based on the fluorescence intensity. (C) After treatment with HG for 24 h, 48 h, and 72 h, the expression level of salusin-β was analysed by Western blotting. (D) After treatment of HG-induced HRECs with increasing concentrations of salusin-β (0.1 nM, 1 nM, and 10 nM) for 48 h, the expression levels of MCP-1, IL-1β, TNF-α, and VCAM-1 were analysed by Western blotting. One-way ANOVA with Tukey’s test was used to assess the differences among the groups. n=3. *p<0.05, **p<0.01, ***p<0.001, ****p<0.0001.
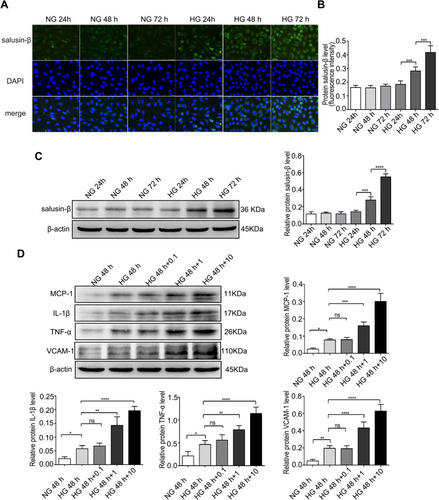
Figure 3 Salusin-β increased ROS production and inflammatory cytokine expression in HG-induced HRECs. Cells were cultured with NG, NG+1 nM salusin-β, HG, and HG + 1 nM salusin-β for 48 h. (A) A ROS fluorescence assay kit was used to determine ROS levels. (B) Statistical analysis of ROS production was performed. (C) The expression levels of MCP-1, IL-1β, TNF-α, and VCAM-1 were analysed by Western blotting. One-way ANOVA with Tukey’s test was used to assess the differences among the groups. n=3. **p<0.01, ***p<0.001, ****p<0.0001.
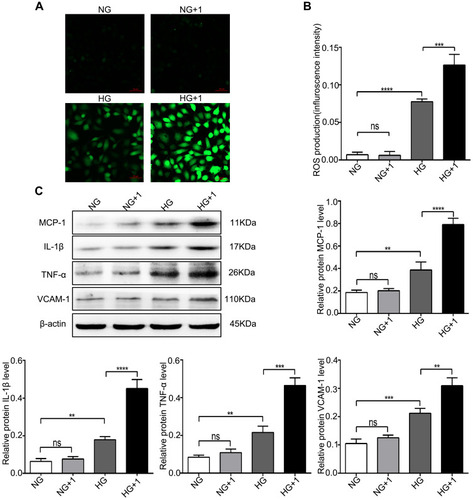
Figure 4 Salusin-β increased apoptosis in HG-induced HRECs. Cells were cultured with NG, NG+1 nM salusin-β, HG, and HG + 1 nM salusin-β for 48 h. (A) The levels of apoptosis-associated proteins, including cleaved caspase-3, Bax, and Bcl2, were analysed by Western blotting. (B) The apoptosis rates were determined by flow cytometry. (C) Statistical analysis of apoptosis rates was performed. One-way ANOVA with Tukey’s test was used to assess the differences among the groups. n=3. *p<0.05, **p<0.01, ***p<0.001.
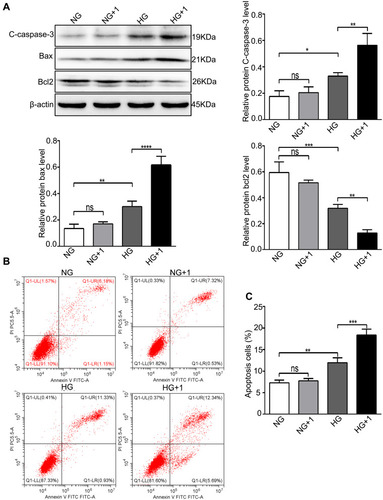
Figure 5 NAC alleviated oxidative stress and the inflammatory response stimulated by salusin-β in HG-induced HRECs. Cells were cultured with NG, HG, HG + 1 nM salusin-β, and HG + 1 nM salusin-β + 5 mM NAC (cells were pretreated with 5 mM NAC for 6 h before incubation with salusin-β in HG medium) for 48 h, and the indicated assays were then performed. (A) A ROS fluorescence assay kit was used to determine ROS levels. (B) Statistical analysis of ROS production was performed. (C) The expression levels of MCP-1, IL-1β, TNF-α, and VCAM-1 were analysed by Western blotting. One-way ANOVA with Tukey’s test was used to assess the differences among the groups. n=3. ****p<0.0001.
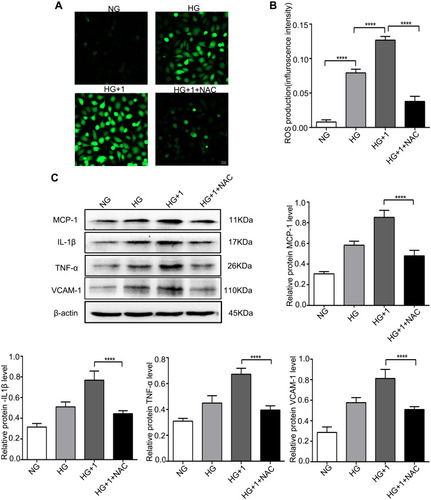
Figure 6 NAC alleviated apoptosis and inhibited the JNK and P38 MAPK pathways stimulated by salusin-β in HG-induced HRECs. Cells were cultured with NG, HG, HG + 1 nM salusin-β, and HG + 1 nM salusin-β + 5 mM NAC (cells were pretreated with 5 mM NAC for 6 h before incubation with salusin-β in HG medium) for 48 h, and the indicated assays were then performed. (A) The levels of apoptosis-associated proteins, including cleaved caspase-3, Bax, and Bcl2, were analysed by Western blotting. (B) Apoptosis rates were determined by flow cytometry. (C) Statistical analysis of the apoptosis rates was performed. (D) The levels of p-JNK, JNK, p-p38 and p38 were analysed by Western blotting. One-way ANOVA with Tukey’s test was used to assess the differences among the groups. n=3. ***p<0.001, ****p<0.0001.
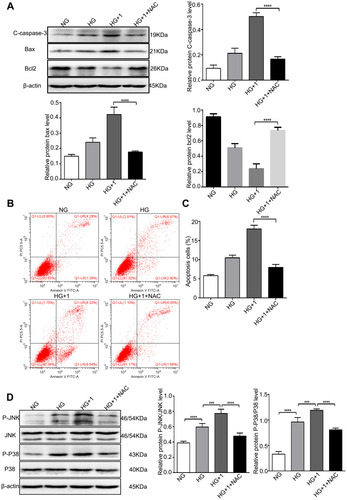
Figure 7 Effectiveness of salusin-β knockdown in HRECs. Salusin-β knockdown attenuated oxidative stress and inflammation in HG-treated HRECs. After adenovirus-mediated transduction of shRNA against salusin-β or scrambled shRNA for 24 h, the indicated assays were performed. (A) The expression of salusin-β was analysed by Western blotting. (B) A ROS fluorescence assay kit was used to determine ROS levels. (C) Statistical analysis of ROS production was performed. (D) The expression levels of MCP-1, IL-1β, TNF-α, and VCAM-1 were analysed by Western blotting. One-way ANOVA with Tukey’s test was used to assess the differences among the groups. n=3. ***p<0.001, ****p<0.0001.
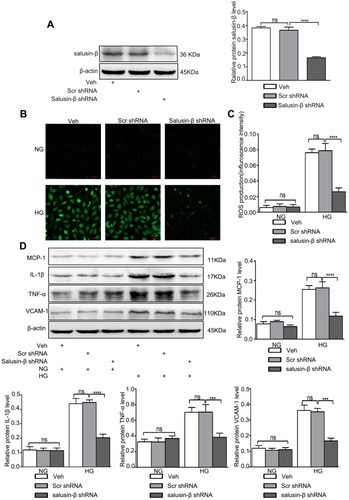
Figure 8 Salusin-β knockdown attenuated apoptosis in HG-treated HRECs. After adenovirus-mediated transduction of shRNA against salusin-β or scrambled shRNA for 24 h, HRECs were cultured in HG medium for 48 h. (A) The levels of apoptosis-associated proteins, including cleaved caspase-3, Bax, and Bcl2, were analysed by Western blotting. (B) Apoptosis rates were determined by flow cytometry. (C) Statistical analysis of the apoptosis rates was performed. One-way ANOVA with Tukey’s test was used to assess the differences among the groups. n=3. *p<0.05, **p<0.01, ***p<0.001.
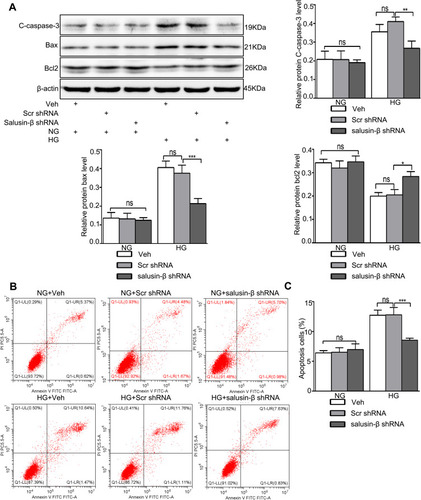
Figure 9 Salusin-β knockdown inhibited the JNK and P38 MAPK pathways activated by HG in HRECs. After adenovirus-mediated transduction of shRNA against salusin-β or scrambled shRNA for 24 h, HRECs were cultured in HG medium for 48 h, and then the levels of p-JNK, JNK, p-p38 and p38 were analysed by Western blotting. n=3. **p<0.01, ****p<0.0001.
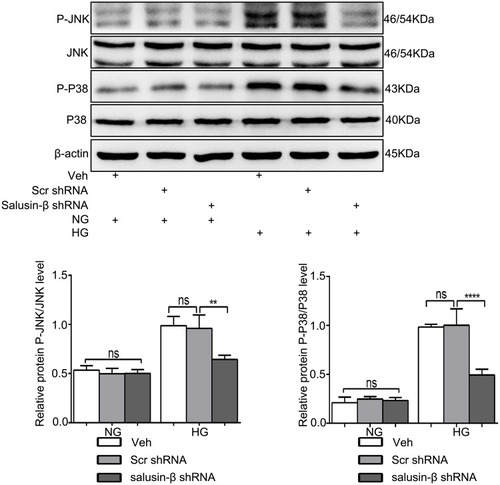
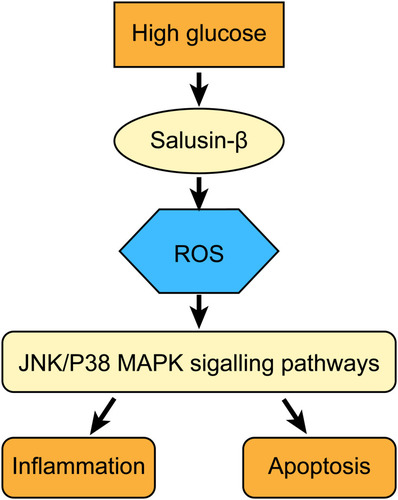
Figure 10 Salusin-β mediates high glucose-induced inflammation and apoptosis in retinal capillary endothelial cells via a ROS-dependent pathway.