
Figures & data
Figure 1 YAP expression in the myocardium in vivo (n=6). (A) Representative immunohistochemical staining of YAP at different time points (scale bar=20 μm). (B) Representative immunohistochemical staining of YAP in the 4 groups (scale bar=20 μm). (C) YAP mRNA expression. (D) Western blot analysis of YAP protein expression. (E) Quantitative analysis of YAP protein expression shown in A. (F) Quantitative analysis of YAP protein expression shown in (B). (G) Quantitative analysis of YAP protein expression shown in (D). *P<0.05 versus the control group; #P<0.05 versus the LV-SC-shRNA group.
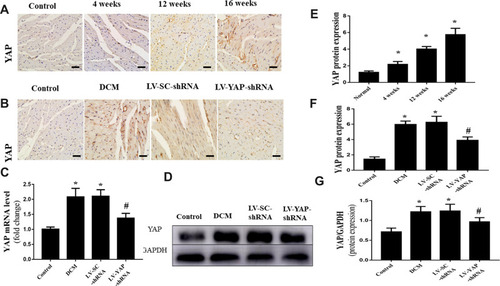
Figure 2 HE staining, CTGF, Profilin-1, and PAI-1 protein expression in the myocardium in vivo (n=6). (A -D) Representative HE staining and immunohistochemical staining of CTGF, Profilin-1 and PAI-1 in the 4 groups (scale bar=20 μm). (E-H) Quantitative analysis of CTGF, Profilin-1, and PAI-1 protein expression. *P<0.05 versus control group; #P<0.01 versus LV-SC-shRNA group.
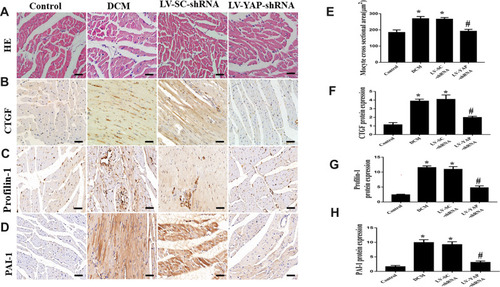
Figure 3 Collagen expression in the myocardium in vivo (n=6). (A and B) Representative immunohistochemical staining of collagen I and collagen III in the 4 groups (scale bar=20 μm). (C–E) Collagen I, collagen III and PAI-1 mRNA expression in the 4 groups. (F and G) Quantitative analysis of collagen I and collagen III protein expression shown in (A) and (B). *P<0.01 versus the control group; #P<0.01 versus the LV-SC-shRNA group.
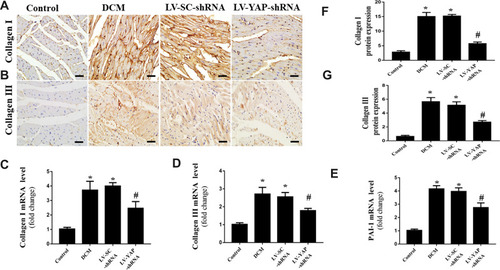
Figure 4(A) Cardiac function data in four groups of rats. M-mode echocardiograms in the 4 groups (n=5). (B) Indicated left ventricular ejection fraction (LVEF) in the 4 groups. (C) Left ventricular end systolic dimension (LVESD) in the 4 groups. (D) Left ventricular end diastolic diameter (LVEDD) in the 4 groups. (E) Ratio of peak early to late diastolic filling velocity (E/A ratio) respective levels in the 4 groups. *P<0.05 versus the control group; #P<0.05 versus the LV-SC-shRNA group.
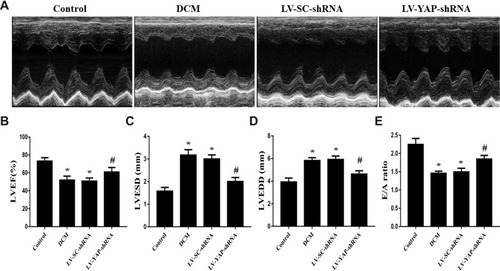
Figure 5 YAP expression and fibrosis levels in CFs in vitro (n=5). (A) Western blot analysis of YAP protein expression stimulated by high glucose (25 mM) at different time points. (B) Western blot analysis of YAP, CTGF and fibronectin protein expression in CFs transfected with YAP-shRNA or scramble-shRNA. (C) Quantitative analysis of YAP protein expression shown in (A). (D) YAP mRNA expression in CFs transfected with YAP-shRNA or Scramble-shRNA. (E–G) Quantitative analysis of YAP, CTGF and fibronectin protein expression shown in (B). *P<0.05 versus the control group transfected with Scramble-shRNA; #P<0.05 versus the high glucose group transfected with Scramble-shRNA; &P<0.05 versus the control group transfected with YAP-shRNA.
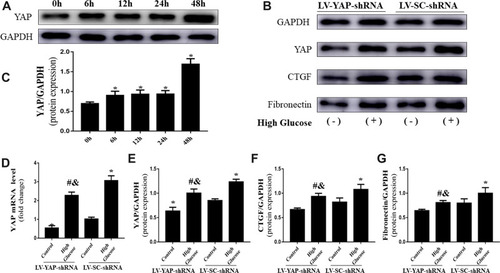
Figure 6 The Co-IP and Ch-IP in neonatal cardiac fibroblasts (CFs) in vitro. (A) The Co-IP results confirmed the interaction between YAP and TEAD in CFs. (B) The Ch-IP results showed YAP activates the CTGF promoter. (C) The amplified fragment of CTGF promoter contains a TEADs motif.
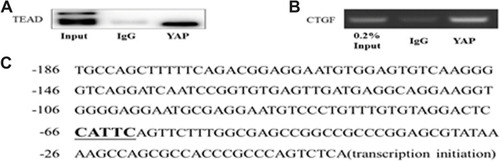
Table 1 The Basic Characteristics of the 4 Groups