
Figures & data
Table 1 Distribution of General Characteristics of the Study Population with and without Metabolic Syndrome
Table 2 Predictors of MetS in Men from Infertile Couples Using Univariate Analysis
Table 3 Predictors of MetS in Men from Infertile Couples Using Logistic Regression Analysis
Figure 1 Comparison of ROC curves between weight, height, hips circumference, BMI, WHR and WHtR, in prediction of MetS in men from infertile couples using univariate analysis. Diagonal segments are produced by ties.
Abbreviations: ROC, receiver operating characteristic; BMI, body mass index; WHR, waist-to-hip ratio; WHtR, waist-to-height ratio; MetS, metabolic syndrome.
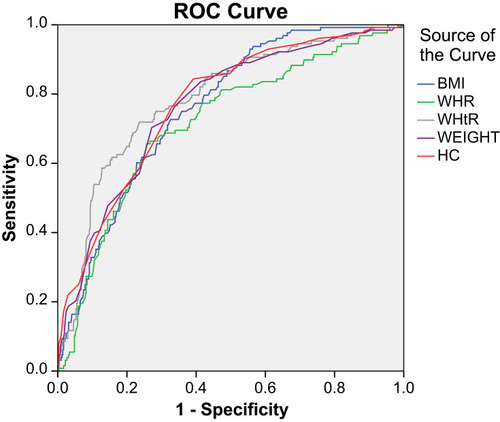
Table 4 The Relation of Anthropometric Factors, Metabolic Components and Semen Analysis Results
Table 5 The Relationship Between Semen Parameters and Metabolic Syndrome
Table 6 The Correlation Between Sperm Morphology and DFI with Anthropometry